Figures & data
Figure 1. Floor plan of the structure. Fires were set in bedrooms 1 and 2 or bedrooms 5 and 6.
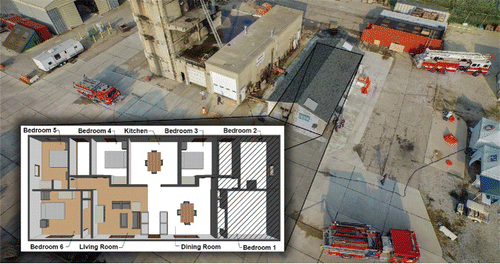
Table 1. Summary of substrate-based and whole-gas area air sampling methods.
Figure 2. Overhead schematic of the air sampling set up used to measure air concentrations inside the structure during the fire period.
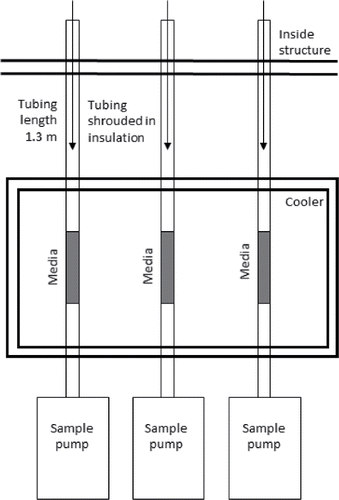
Table 2. Summary of direct reading particle measurements.
Table 3. Summary of personal air concentrations by position.
Table 4. Area air concentrations measured from the living room during the fire period.
Figure 3. Average total PAH concentrations measured from the living room during three fires using the tubing method (where air from the structure was drawn through tubing into the sampling media) and the direct-sampling method (where air from the structure was drawn directly into the sampling media). Also provided are the IARC classifications for each PAH species. Class 1 = carcinogenic to humans; 2A = probably carcinogenic to humans, 2B = possibly carcinogenic to humans, and 3 = not classifiable.
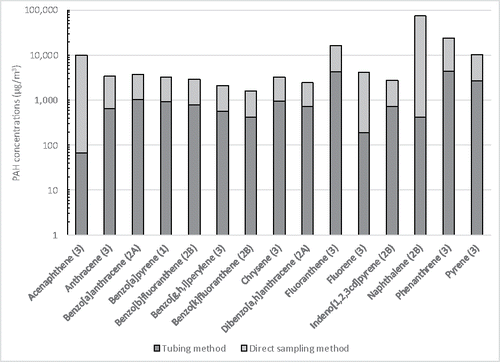
Figure 4. (A) Total PAH and (B) benzene concentrations measured from the living room during the fire, from the initial burn room (bedroom) during overhaul, and in the fireground during the response. The box and whiskers provide the minimum, 25th percentile, median, 75th percentile, and maximum values. The shaded horizontal bar provides the interquartile range of the background levels (measured before ignition) for benzene. Background concentrations of PAHs were non-detectable (<9.8 µg/m3) as represented by the dotted line. Dashed lines are provided for applicable exposure limits.
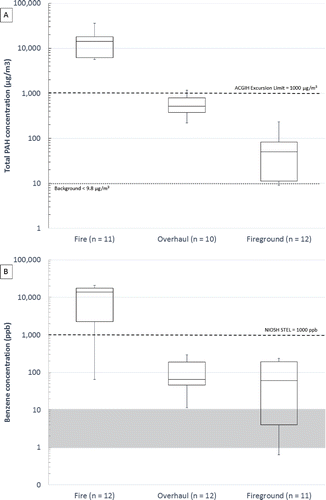
Figure 5. (A) Particle number and (B) respirable mass concentrations measured from the living room during the fire, from the initial burn room (bedroom) during overhaul, and in the fireground during the response. The box and whiskers provide the minimum, 25th percentile, median, 75th percentile, and maximum values. The shaded horizontal bar provides the interquartile range of the background levels.
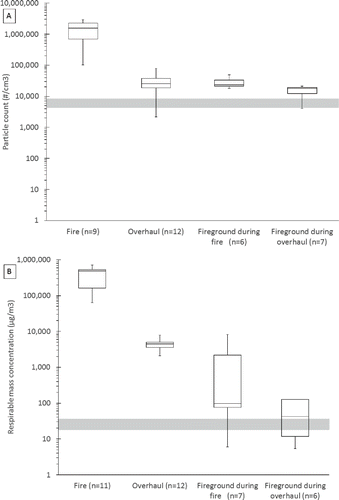
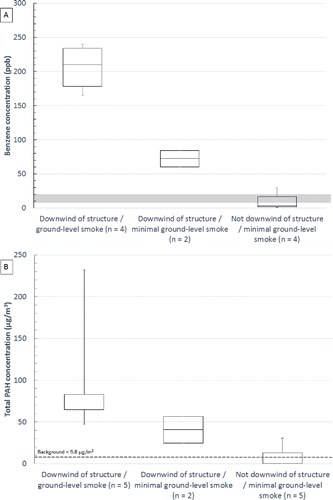
Figure 6. (A) Benzene and (B) total PAH concentrations measured in the fireground stratified by environmental conditions. The box and whiskers provide the minimum, 25th percentile, median, 75th percentile, and maximum values. The interquartile range of background levels is also provided for benzene. Background levels of PAHs were non-detectable (<9.8 µg/m3).