
Figures & data
Figure 1. Proposed model for CP’s drivers
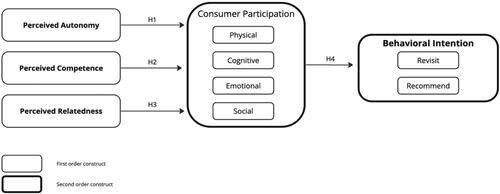
Table 1. Descriptive statistics of all items.
Table 2. Competing models testing.
Table 3. Comparative results among two countries/events.
Table A1. Demographic information of the respondents.
Table A2. Exploratory factor analysis: sample (N = 320).
Table A3. Confirmatory factor analysis: sample (n = 320).
Table A4. Discriminant validity.