Figures & data
Figure 1. Summary of tissue transplantation and astrogenesis of developing brain within the LN. Schematic view of transplantation of multiple E14.5/15.5 tissues into the LN (scale bar, 1mm) (A). Table shows number of LNs repopulated by different tissues (B). Hematoxylin and Eosin (H&E) staining of a paraffin section of donor mid-embryonic brain before transplantation (upper left); whole-mount jejunal LN 3 weeks after brain transplantation (B3, upper right), and pictures of frozen LN sections (B3 and B4, 2 independent samples) with the presence of GFP+ (green) donor cells (lower). Nuclei were counterstained using Hoechst (blue) (C). Pictures of B3 and B4 LN sections stained for GFAPδ (red) with the presence of GFP+ (green) donor cells. Nuclei were counterstained using Hoechst (blue) (D).
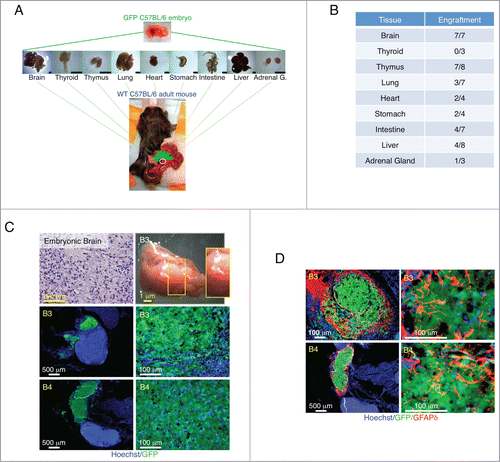
Figure 2. The LN does not provide a permissive environment for neurogenesis from neural stem and progenitor cells. Appearance of 5 d floating primary neurospheres (panels 1–2); intact spheres (panel 3) or single cells (panel 4) used for LN injections, and immunofluorescence staining for Nestin, SOX2, or Ki-67 (right, red). Nuclei were counterstained using Hoechst (blue) (A). Table shows a summary of LN engraftment outcome in 20 mice injected with neurospheres in 2 separate experiments (B). Immunofluorescence staining for GFAPδ (left, red) or MAP-2 (right, red) with GFP+ donor cells (green). Nuclei were counterstained using Hoechst (blue) (C).
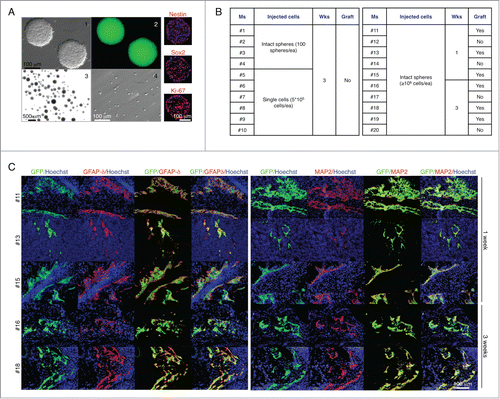
Figure 3. Granulocyte/macrophage progenitor accumulation following E14.5/15.5 thymus transplantation within the LN, and host contribution in the generation of the ectopic thymic cortex. Representative fluorescence intensity histograms of granulocytes/myeloid cells from mouse 2 (M2) analyzed for Ly6G-Ly6C (upper) or CD11b (lower) at 0, 3, 6, 12, or 21 weeks after thymus transplant (A). Dot plots showing frequency of CD11b+/Ly6G-Ly6C−/low, CD11b+/Ly6G-Ly6Cint, and CD11b+/Ly6G-Ly6Chigh at 0, 3, 6, 12, or 21 weeks after thymus transplant. Each symbol represents one mouse, and the horizontal bars represent the median values. * P < 0 .05, ** P < 0 .01, *** P < 0 .001 (B). Agarose gel electrophoresis of PCR products following semi-quantitative RT-PCR analysis for GM-CSF (expected amplicon size of 431 bp) in mid-embryonic thymus (EmT), 6- (6wEcT) or 21-week ectopic thymus (21wEcT), and adult thymus (AdT). Wild type LN (LN) was used as a negative control. Amplification of GAPDH was used as an internal control. The densitometric scanning data from 2 experiments are shown as bar graphs of GM-CSF/GAPDH ratio on the right (6wEcTs were isolated from M4 and M5, while 21wEcTs were isolated from M1 and M3) (C). Picture of a native thymus gland isolated from a C57BL/6 GFP+ embryo (upper left) and H&E staining of a paraffin section of native mid-embryonic thymus (EmT, upper right); whole-mount mouse jejunal LNs 21 weeks after thymus transplantation, showing 3 different engraftments (21wEcT, lower) (D). Immunofluorescence staining for GFP (red), keratin 8 (K8, red), keratin 5 (K5, red), CD31 (red) or CD105 (red) of 21-week ectopic thymus with the presence of GFP+ (green) donor cells. Nuclei were counterstained using Hoechst (blue) (GFP, K8, K5 pictures were taken from a LN isolated from M2, while CD31 and CD105 pictures were taken from a LN isolated from M6) (E).
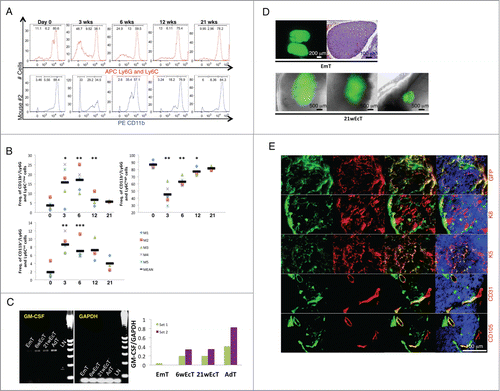
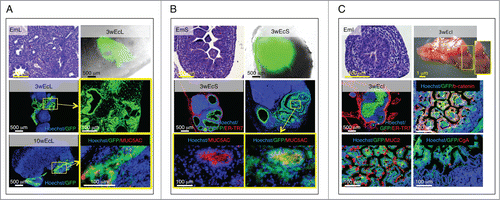
Figure 4. Presence of terminally differentiated, mucus-producing cells in ectopic lung, stomach and intestinal tissues. Each panel shows an H&E staining of a paraffin section of donor mid-embryonic lung (EmL), stomach (EmS) or intestine (EmI); whole-mount jejunal LN 3 weeks after transplantation of lung (3wEcL), stomach (3wEcS) or intestine (3wEcI), and pictures of frozen LN sections stained with specific markers (red) with the presence of GFP+ (green) donor cells. Nuclei were counterstained using Hoechst (blue) (ER-TR7, Reticular Fibroblasts and Reticular Fibers; CgA, chromogranin A) (A-C).