Figures & data
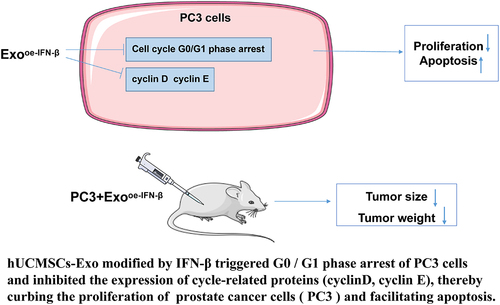
Table 1. Primer sequences.
Figure 1. Extraction and characterization of hUCMSC-Exos. (a): morphology of Exos observed by TEM; (b): size of Exos determined by NTA; (c): expression patterns of positive markers CD63, CD9, and CD81 as well as negative marker calnexin on the surface of Exos detected by Western blot. GW4869 was an inhibitor released by Exos.
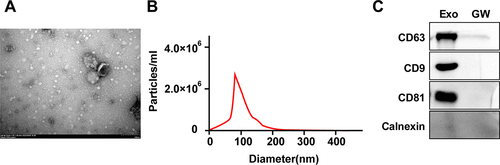
Figure 2. IFN-β-modified hUCMSC-Exos hampered proliferation and accelerated apoptosis of PCa cells. (a): IFN-β mRNA level in hUcmscs measured by RT-qPCR; (b): IFN-β expression in hUcmscs measured by ELISA kits; (c): IFN-β mRNA levels in Exos measured by RT-qPCR; (d): IFN-β expression in Exos measured by ELISA kits; (e): the uptake of Exos by PCa cells; (f): IFN-β mRNA level in PC3 cells measured by RT-qPCR; (g): IFN-β expression in PC3 cells measured by ELISA; (h): cell proliferation assessed by CCK-8; (i): cell proliferation assessed by EdU staining; (j): cell apoptosis assessed by flow cytometry. Proteinase K could be used to degrade the envelope protein; triton X-100 could destroy the phospholipid bilayer structure of Exos. Data were presented as mean ± SD, and one-way ANOVA was implemented for comparisons among multiple groups, followed by Tukey’s test. **p < .01, ***p < .001.
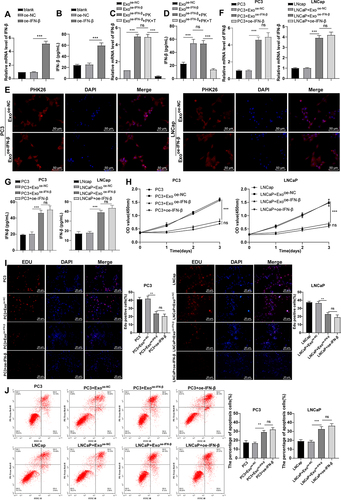
Figure 3. Inhibition of IFN-β partially counteracted the effect of IFN-β-modified hUCMSC-Exos on PC3 cell growth. (a): RT-qPCR determined IFN-β mRNA level in hUcmscs; (b): ELISA kits determined IFN-β expression in hUcmscs; (c): RT-qPCR determined IFN-β mRNA level in Exos; (d): ELISA kits determined IFN-β expression in Exos; (e): RT-qPCR determined IFN-β mRNA level in PCa cells; (f): ELISA determined IFN-β expression in PCa cells; (g): CCK-8 evaluated cell proliferation; (h): EdU staining evaluated cell proliferation; I: flow cytometry assessed cell apoptosis. Data were displayed as mean ± SD, and one-way ANOVA was conducted for comparisons among multiple groups, followed by Tukey’s test. *p < .05, **p < .01, ***p < .001.
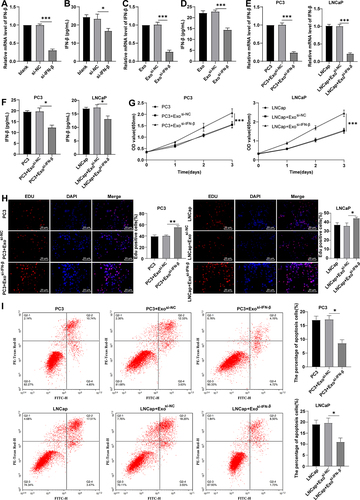
Figure 4. IFN-β-modified hUCMSC-Exos induced PCa cell cycle arrest by regulating cycle-related proteins. (a): flow cytometry detected cell cycle (the percentage of cells arrested in G0/G1, S, and G2/M phases); (b): Western blot determined expression levels of cell cycle-related proteins (cyclin D and cyclin E). One-way ANOVA was used for comparisons among multiple groups, followed by Tukey’s test. *p < .05, **p < .01, ***p < .001.
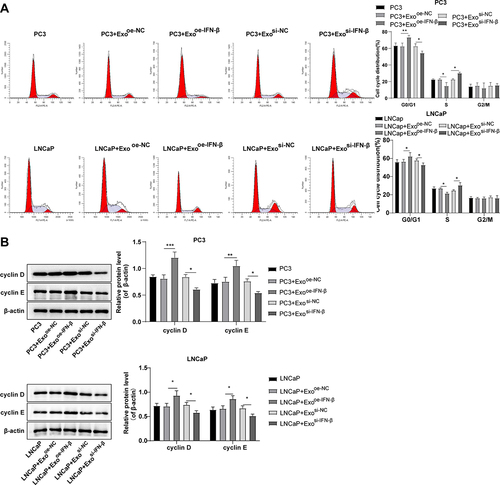
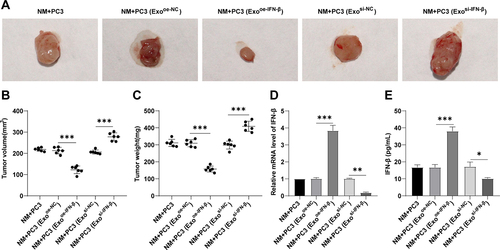
Figure 5. IFN-β-modified hUCMSC-Exos repressed PCa progression in vivo. (a,b): volume of the xenograft tumor, n = 6; (c): weight of the xenograft tumor, n = 6; D: IFN-β mRNA level in tumor tissues determined by RT-qPCR, n = 6; E: IFN-β expression in tumor tissues determined by ELISA kit, n = 6. One-way ANOVA was performed for comparisons among multiple groups, followed by Tukey’s test. *p < .05, **p < .01, ***p < .001.