2,358
Views
46
CrossRef citations to date
0
Altmetric
RESEARCH PAPERS

The C-terminal RNA binding motif of HuR is a multi-functional domain leading to HuR oligomerization and binding to U-rich RNA targets

, , , , , , & show all
Pages 1250-1261 | Received 20 Sep 2014, Accepted 20 Sep 2014, Published online: 27 Jan 2015

Figures & data

Figure 1. Schematic Domain Organization of HuR. The positions of the phosphorylation site S318, and of W261, responsible for HuR dimerization, are both marked. The HuR Nucleocytoplasmic Shuttling sequence (HNS) is also represented. The boundaries of RRM3 construct used in this work are from W244 to K326 in reference to the HuR FL protein.

Figure 1. Schematic Domain Organization of HuR. The positions of the phosphorylation site S318, and of W261, responsible for HuR dimerization, are both marked. The HuR Nucleocytoplasmic Shuttling sequence (HNS) is also represented. The boundaries of RRM3 construct used in this work are from W244 to K326 in reference to the HuR FL protein.

Figure 2. The RRM3 of HuR. (A)1H-15N-HSQC spectrum of HuR RRM3. Labels stand for the amino acids of RRM3 following the numbers of HuR FL protein. The signals in orange are folded in the15N dimension and the correct chemical shifts are indicated in brackets. The asterisk stands for residue T293. Most of the unlabeled signals correspond to residues N-terminal to the HuR RRM3 sequence coming from the cloning strategy. (B) Structural model of HuR RRM3 domain built using chemical shifts of backbone atoms as restraints in the CS23D server. The α-helices are depicted in red and β-strands in blue. The side-chain of S318, which becomes phosphorylated, is highlighted in yellow. Residues between W261 and T271, which are not observed in the NMR spectra, are colored in green. The structure views are rotated 180° around the vertical axis.

Figure 2. The RRM3 of HuR. (A)1H-15N-HSQC spectrum of HuR RRM3. Labels stand for the amino acids of RRM3 following the numbers of HuR FL protein. The signals in orange are folded in the15N dimension and the correct chemical shifts are indicated in brackets. The asterisk stands for residue T293. Most of the unlabeled signals correspond to residues N-terminal to the HuR RRM3 sequence coming from the cloning strategy. (B) Structural model of HuR RRM3 domain built using chemical shifts of backbone atoms as restraints in the CS23D server. The α-helices are depicted in red and β-strands in blue. The side-chain of S318, which becomes phosphorylated, is highlighted in yellow. Residues between W261 and T271, which are not observed in the NMR spectra, are colored in green. The structure views are rotated 180° around the vertical axis.

Figure 3. Oligomerization of HuR RRM3. (A) Sedimentation equilibrium measurements of RRM3. The apparent molecular weight (MW) is determined as 19033 ± 1425 Da, larger than the expected for a monomer (14342.2 Da). (B) Sedimentation velocity measurements on RRM3 (S is the sedimentation coefficient). (C) Sedimentation velocity measurements on RRM3 W261E done as in (B). (D) Overlay of the1H-15N-HSQC spectra of RRM3 WT (gray) and RRM3 W261E (black). The resonances of the W261-T271 segment are labeled. A proline residue is at position 266. (E) Comparison of the CS23D structural models of RRM3 WT (light gray) and RRM3 W261E (dark gray). The RMSD for backbone atoms between both models is 1.5 Å, being the main differences at the β23 and α24 flexible loops. The structure views are rotated 180° around the vertical axis.

Figure 3. Oligomerization of HuR RRM3. (A) Sedimentation equilibrium measurements of RRM3. The apparent molecular weight (MW) is determined as 19033 ± 1425 Da, larger than the expected for a monomer (14342.2 Da). (B) Sedimentation velocity measurements on RRM3 (S is the sedimentation coefficient). (C) Sedimentation velocity measurements on RRM3 W261E done as in (B). (D) Overlay of the1H-15N-HSQC spectra of RRM3 WT (gray) and RRM3 W261E (black). The resonances of the W261-T271 segment are labeled. A proline residue is at position 266. (E) Comparison of the CS23D structural models of RRM3 WT (light gray) and RRM3 W261E (dark gray). The RMSD for backbone atoms between both models is 1.5 Å, being the main differences at the β2-β3 and α2-β4 flexible loops. The structure views are rotated 180° around the vertical axis.
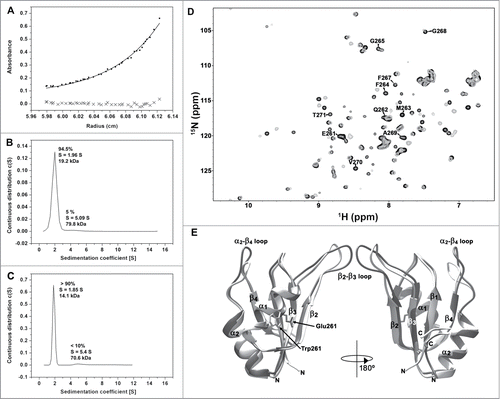
Figure 4. Molecular Dynamic Simulations of Dimeric HuR RRM3. (A) Overlay of RRM3 dimer conformer A model and the unit cell of X-ray structure of HuR RRM1 (pdb code 3hi9). RRM3 ribbons are colored according to secondary structure: α-helixes in red, β-strands in blue. RRM1 is in translucent cyan. The indole rings of W261 in the dimer are represented in yellow spheres. (B) Overlay of RRM3 dimer conformation B model and the HuR RRM1 unit cell. Color code and representations are the same as in (A). (C) Time evolution of overall RMSD values for the RRM3 WT dimer conformers A (black trace) and B (green), and the W261E conformers A (blue) and B (red). W261E initial structures were modeled on those at the end of the corresponding WT trajectories. (D) Time evolution of the radius of gyration of dimers along trajectories. Color code is the same as in (C).

Figure 4. Molecular Dynamic Simulations of Dimeric HuR RRM3. (A) Overlay of RRM3 dimer conformer A model and the unit cell of X-ray structure of HuR RRM1 (pdb code 3hi9). RRM3 ribbons are colored according to secondary structure: α-helixes in red, β-strands in blue. RRM1 is in translucent cyan. The indole rings of W261 in the dimer are represented in yellow spheres. (B) Overlay of RRM3 dimer conformation B model and the HuR RRM1 unit cell. Color code and representations are the same as in (A). (C) Time evolution of overall RMSD values for the RRM3 WT dimer conformers A (black trace) and B (green), and the W261E conformers A (blue) and B (red). W261E initial structures were modeled on those at the end of the corresponding WT trajectories. (D) Time evolution of the radius of gyration of dimers along trajectories. Color code is the same as in (C).

Figure 5. RNA binding of HuR RRM3 with the 5´-UUUUU-3´ (A,B) and 5´-AUUUA-3´ RNAs (C,D) by NMR. (A,C) Overlay of selected regions of the1H-15N-HSQC spectra of free HuR RRM3 (black) and bound to RNA oligos in a RNA:protein ratio of 2:1 (blue) and 4:1 (red). (B,D) Map of HuR RRM3 interface upon binding to RNA. RRM3 surface is rotated 180˚ around the vertical axis in each view. Residues are colored, according to Δδavg (ppm): blue for values< 0.025, yellow for 0.025 ≤ Δδavg ≤ 0.075 and orange for values > 0.075. Resonances broadened beyond the detection limit are colored in red. Prolines and unassigned resonances are indicated in gray.

Figure 5. RNA binding of HuR RRM3 with the 5´-UUUUU-3´ (A,B) and 5´-AUUUA-3´ RNAs (C,D) by NMR. (A,C) Overlay of selected regions of the1H-15N-HSQC spectra of free HuR RRM3 (black) and bound to RNA oligos in a RNA:protein ratio of 2:1 (blue) and 4:1 (red). (B,D) Map of HuR RRM3 interface upon binding to RNA. RRM3 surface is rotated 180˚ around the vertical axis in each view. Residues are colored, according to Δδavg (ppm): blue for values< 0.025, yellow for 0.025 ≤ Δδavg ≤ 0.075 and orange for values > 0.075. Resonances broadened beyond the detection limit are colored in red. Prolines and unassigned resonances are indicated in gray.

Figure 6. RNA binding of HuR RRM3 with the AUUUA motif 25-mer RNA by CD. Left – Far-UV CD data of the 5′-AUUUAUUUAUUUAUUUAUUUAUUUA-3′ 25-mer RNA molecules at different concentrations of the HuR RRM23 construct. Inset: Normalized first and second principal components resulting from covariance analysis of the CD spectra along the titration. The first one (continuous line) accounts for a 90.7 % of the spectral changes; the second (dashed line) for a 7.9 % of them. Right - Projection of the titration data in left panel on their first principal component obtained by covariance analysis of the whole spectra. Data was fitted according to a model considering 4 binding sites on RNA with similar affinity toward the protein.
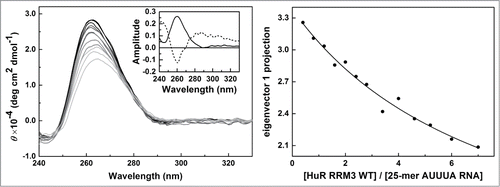
Figure 6. RNA binding of HuR RRM3 with the AUUUA motif 25-mer RNA by CD. Left – Far-UV CD data of the 5′-AUUUAUUUAUUUAUUUAUUUAUUUA-3′ 25-mer RNA molecules at different concentrations of the HuR RRM23 construct. Inset: Normalized first and second principal components resulting from covariance analysis of the CD spectra along the titration. The first one (continuous line) accounts for a 90.7 % of the spectral changes; the second (dashed line) for a 7.9 % of them. Right - Projection of the titration data in left panel on their first principal component obtained by covariance analysis of the whole spectra. Data was fitted according to a model considering 4 binding sites on RNA with similar affinity toward the protein.

Figure 7. HuR RRM3 S318D: (A) phosphomimetic mutant. (A) Overlay of 1H-15N-HSQC spectra of HuR RRM3 S318D in the absence (black) and presence of 5′-UUUUU-3′ RNA at a RNA:protein ratio of 2:1 (blue) and 4:1 (red). A subset of 4 representative resonances is labeled in black. (B) Comparison of average chemical shift differences (Δδavg) between free and RNA-bound HuR RRM3 WT (black) and HuR RRM3 S318D (red) in a ratio of 4:1 for 5′-UUUUU-3′ RNA. Secondary structure elements of RRM3 are symbolized by blue arrows for β-strands and red coil symbols for α-helices. Asterisks indicate those residues disappearing upon RNA binding to the RRM3 WT or S318D mutant. (C) Changes in the far-UV CD signal of the 25-mer U-rich RNA spectrum during the titration with HuR RRM3 S318D construct.

Figure 7. HuR RRM3 S318D: (A) phosphomimetic mutant. (A) Overlay of 1H-15N-HSQC spectra of HuR RRM3 S318D in the absence (black) and presence of 5′-UUUUU-3′ RNA at a RNA:protein ratio of 2:1 (blue) and 4:1 (red). A subset of 4 representative resonances is labeled in black. (B) Comparison of average chemical shift differences (Δδavg) between free and RNA-bound HuR RRM3 WT (black) and HuR RRM3 S318D (red) in a ratio of 4:1 for 5′-UUUUU-3′ RNA. Secondary structure elements of RRM3 are symbolized by blue arrows for β-strands and red coil symbols for α-helices. Asterisks indicate those residues disappearing upon RNA binding to the RRM3 WT or S318D mutant. (C) Changes in the far-UV CD signal of the 25-mer U-rich RNA spectrum during the titration with HuR RRM3 S318D construct.
Supplemental material

supplement_mtl_KRNB_996069.docx

Download MS Word (9.2 MB)

Reprints and Corporate Permissions

Please note: Selecting permissions does not provide access to the full text of the article, please see our help page How do I view content?

To request a reprint or corporate permissions for this article, please click on the relevant link below:

Academic Permissions

Please note: Selecting permissions does not provide access to the full text of the article, please see our help page How do I view content?

Obtain permissions instantly via Rightslink by clicking on the button below:

If you are unable to obtain permissions via Rightslink, please complete and submit this Permissions form. For more information, please visit our Permissions help page.