
Figures & data
Figure 1. The proportion of tRNA-seq reads at different lengths based on isoacceptor family. Black dots represent the proportion of isoacceptor reference sequences at indicated length (e.g. 100% of the Ala-tRNA reference genes are 76 nt in length). Three biological replicates are plotted for each treatment (AlkB+, AlkB- and untreated). Note that the dominant peak for read length often corresponds to the length of the reference sequence(s).
Table 1. Total proportion of reference nucleotides misread ≥30% of the time in Arabidopsis thaliana libraries
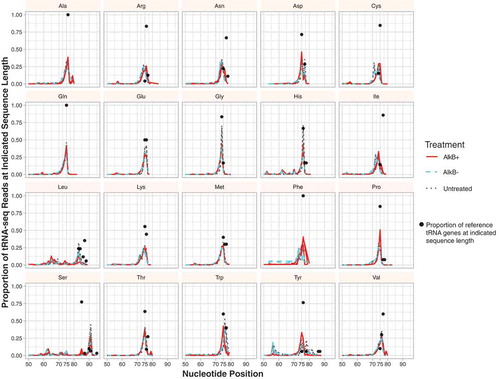
Table 1. Total proportion of reference nucleotides misread ≥30% of the time in Arabidopsis thaliana libraries
Figure 2. Demethylation treatment with AlkB increases the proportion of tRNA-seq reads for many tRNAs (points falling above the 1:1 line). Average read counts per million across three biological replicates are shown for each unique A. thaliana tRNA reference sequence in AlkB+ vs. untreated libraries
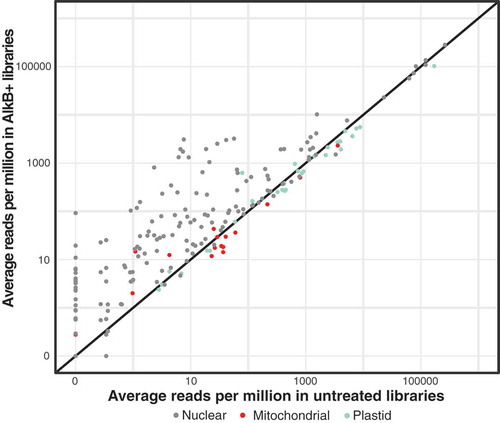
Figure 3. tRNA-seq read abundance in A. thaliana tRNA is dominated by nuclear tRNA-Pro and plastid tRNA-GlyGCC genes. All nuclear tRNA-Pro genes are shown and indicated by grey colours, with the darkest greys indicating the highest abundance, and the plastid tRNA-GlyGCC is indicated by teal. All other tRNAs have been grouped and shown in black
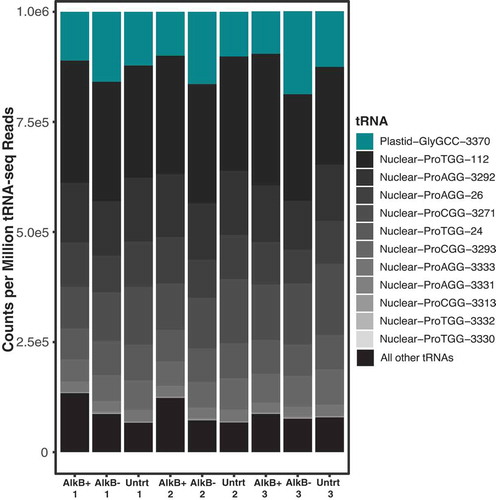
Figure 4. tRNA-seq read abundance is similarly dominated by only two isoacceptor families (tRNA-Pro and tRNA-Gly) in four angiosperm species
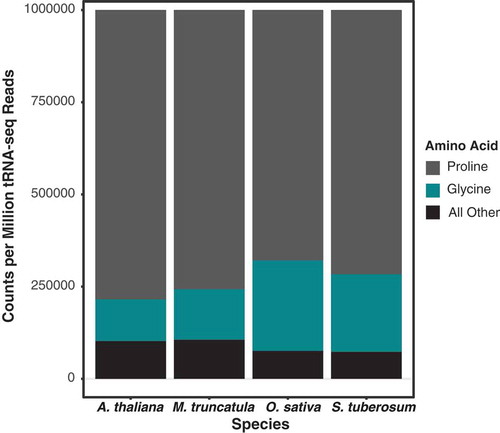
Figure 5. Droplet digital PCR (ddPCR) copies correlate with number of tRNA-seq reads. ddPCR copies per ng of cDNA plotted against counts per million tRNA-seq reads for four A. thaliana tRNA genes. Adjusted R2 values for separate linear regressions on biological replicates 1, 2, and 3 were 0.79, 0.85, and 0.96, respectively. When data points were averaged across biological replicates, linear regression yielded an adjusted R2 of 0.91 and a p-value of 0.03
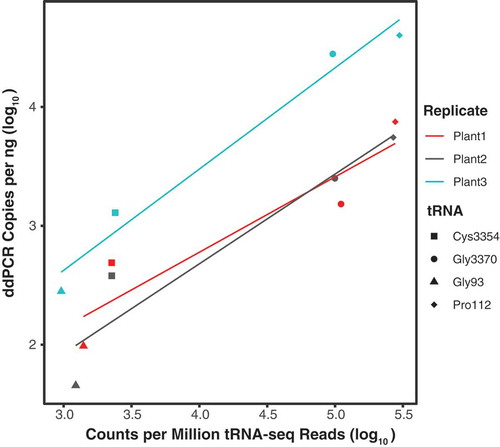
Figure 6. Northern blot analysis does not show the same expression dominance of nuclear tRNA-Pro and plastid tRNA-GlyGCC that was observed with tRNA-seq. Four different A. thaliana tRNA genes were probed from total cellular RNA and quantified. Each tRNA target membrane had three replicates of total A. thaliana RNA, which was quantified using a dilution series of a synthesized 38-nt oligonucleotide complementary to the corresponding probe. A single lane of a 38-nt mismatched oligonucleotide (MM), which had one or two non-complementary nucleotides relative to the probe, was also included on each membrane to test for cross-hybridization of probes. The amounts of total RNA and oligonucleotides loaded on each blot were varied according to expected hybridization signal based on preliminary analyses. The mass of RNA and pmols of oligonucleotides are indicated above each corresponding lane. The estimated concentration of the target tRNA based on analysis of signal intensity in ImageJ is reported as pmols per μg of input RNA. The average Illumina tRNA-seq read counts per million (CPM) is indicated parenthetically for each tRNA
Figure 7. A tRNA modification index showing the proportion of all A. thaliana tRNA reference sequences with a misincorporation/deletion at each nucleotide position. A position was considered modified if ≥30% of the mapped reads differed from the reference sequence and the sequence was detected by more than five reads. Pie charts show the identity of the misincorporated base at some of the most frequently modified positions. A separate pie chart is provided for each observed reference base at that position, and the percentage indicates what proportion of modified tRNA sequences have that reference nucleotide. All three replicates of each treatment are shown and indicated by line colour. Because the y-axis is expressed as a proportion of tRNA reference sequences (and not total reads), genes such as nuclear tRNA-Pro and plastid tRNA-GlyGCC are not preferentially weighted in this analysis even though they represent the majority of reads.
Table 2. Total misincorporation frequency of tRNA reference bases across all nine Arabidopsis thaliana tRNA-seq libraries (see )
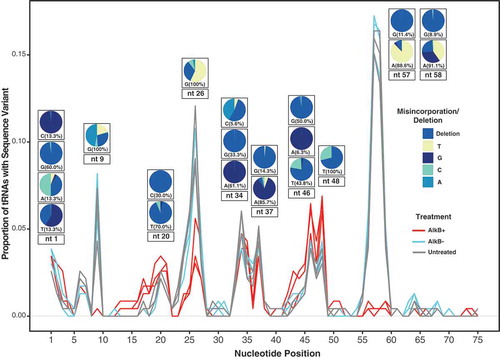
Table 2. Total misincorporation frequency of tRNA reference bases across all nine Arabidopsis thaliana tRNA-seq libraries (see )
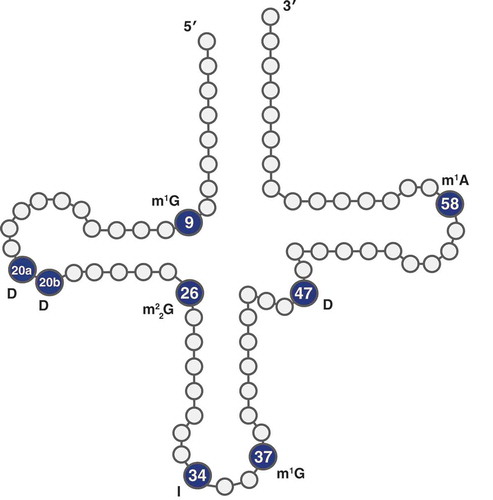
Figure 8. tRNA positions labelled with possible modifications. Positions with strong misincorporation signals are indicated with a known modification at that position in other species. D: dihydrouridine; I: inosine; m1A: N1-methyladenosine; m1 G: N1-methylguanosine; m22 G: N2,N2-dimethylguanosine
Supplemental Material
Download Zip (9.1 MB)Data availability statement
Sequencing reads are available via the NCBI Sequence Read Archive under BioProject PRJNA562543. https://www.ncbi.nlm.nih.gov/bioproject/?term=PRJNA562543.