
Figures & data
Figure 1. Identification of Drosha splice variants in human cells.
(A) Schematic representation of library construction procedures for PacBio sequencing. (B) Quantitation of Drosha full length (FL) transcripts and splice variants based on PacBio sequencing results in four human cell lines. (C) Schematic diagram of most abundant Drosha transcripts in HEK293T cells. ATG and TAA indicated positions of translation start codon and stop codon in exons, respectively. Dashed-line box indicates where major splicing events were identified in the coding regions. (D) Validation of Drosha alternative splice variants by RT-PCR. Drosha cDNAs were amplified with primers spanning exon27-exon28 and exon32-exon33, respectively. PCR products were confirmed with Sanger sequencing and are labelled correspondingly in the agarose gel image. (E) Quantification of Drosha isoforms in human cells. The amount of each isoform in HEK293T, HeLa, MCF-7, and U2OS cells was measured by real-time qPCR with isoform-specific primers (See methods for more details). The corresponding standard curves can be found in Supplementary Fig. S3.
Figure 2. Characterization of Drosha-AS27a and Drosha-AS32a isoforms.
(A) Sequence alignment of amino acids encoded by Drosha-FL and alternative splice variants. Upper panel indicates where exon 27a and exon 32a are located in the Drosha protein domain. In the lower panel, sequence differences between amino acids in Drosha-FL and Drosha-AS27a, or between Drosha-FL and Drosha AS32 are highlighted in grey. The signature motifs of the RNase III domain are indicated by the dashed-line box. Amino acid residues critical for cleavage activity are highlighted in black. (B) Western blot detecting protein expression of Drosha alternative splicing variants in Drosha KO cells. As previously described, N-terminal truncated Drosha resulting from degradation was also detected and labelled with *. Unspecific bands for anti-FLAG antibody were labelled with #. (C) RT-qPCR was used to quantitate mRNA levels of Drosha splicing variants. (D) Western Blot detecting ectopic expression of Drosha-AS27a in Drosha KO cells upon treatment with either DMSO or Bortezomib (MG341, 200 nM) for 12 hours. (E) Dual-luciferase assays to measure Drosha cleavage activity. Cleavage reporters containing either pri-miR-16-1 or pri-let-7a-1 were co-transfected with empty vectors or plasmids expressing Drosha-FL or Drosha-AS32a into Drosha KO cells. See more details in Supplementary Fig. S4.
Figure 3. Drosha-AS27a and Drosha-AS32a are deficient in miRNA biogenesis.
(A) Schematic diagram of experimental workflow for investigation of Drosha-AS27a and Drosha-AS32a function. (B) Northern blot to analyse the function of Drosha-AS27a and Drosha-AS32a in miR-16 processing. CMV (Pol II) driven pri-miR-16 was ectopically expressed in HEK293T cells, as well as co-expressed with various Drosha variants in the Drosha KO cells. Pri-miRNA-16 transcripts are too long to run into the polyacrylamide gel. Pre-miR-16 and mature miR-16 were detected by a probe against the sequence of miR-16. The expression of U6 served as a loading control. (C) Levels of endogenous miRNAs were measured by small RNA sequencing in HEK293T cells and Drosha KO cells rescued with Drosha-FL, Drosha-AS27a, or Drosha-AS32a. For each miRNA, the average level of two biological replicates was calculated. miRNAs with an average expression >10 reads per million (RPM) in WT HEK293T cells were plotted.
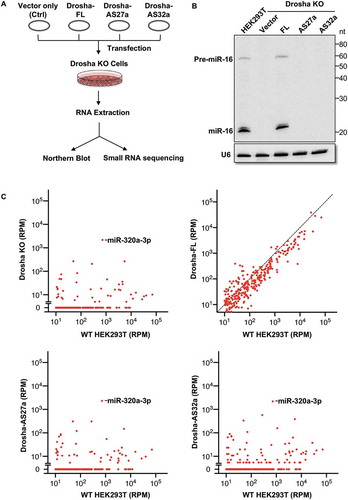
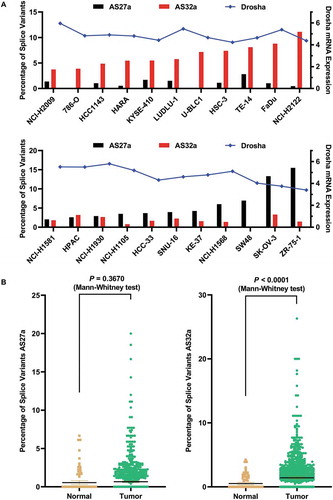
Figure 4. AS27a and AS32a are abundant in cancer cell lines and their levels are elevated in some breast cancer patients.
(A) Percentage of Drosha splice variants AS27a and AS32a in cancer cell lines. The RNA-seq data of cancer cell lines were obtained from CCLE database. The cell lines with a minimum of 20 AS27a-specific reads or 40 AS32a-specific reads were sorted by the percentage of AS27a or AS32a and plotted in the left Y axis. Drosha expression level (log2-transformed FPKM values) in each corresponding cell line was plotted in the right Y axis. (B) Percentage of Drosha splice variants AS27a and AS32a in breast normal and tumour tissues. The RNA-seq data of normal and tumour tissues were obtained from TCGA database. Normal, n = 104; Tumour, n = 1162.
Supplemental material