
Figures & data
Figure 1. The dsRNA receptor SID-2 does not enhance dsRNA uptake for nutritional reasons
A) Potential sources of nucleotides contributing to egg hatching. Egg hatching depends on the availability of sufficient pyrimidines within the animal. Pyrimidines can be synthesized by pyr-1, taken up from the environment or potentially derived from environmental dsRNA taken up by SID-2.B) Percentage of viable eggs after pyrimidine supplementation or feeding dsRNA in wild type, sid-2(qt142), pyr-1(cu8) or pyr-1(cu8); sid-2(qt142). Black stars represent the percentage of viable eggs of a biological replicate. Horizontal black lines indicate the mean, vertical black lines the standard deviation.
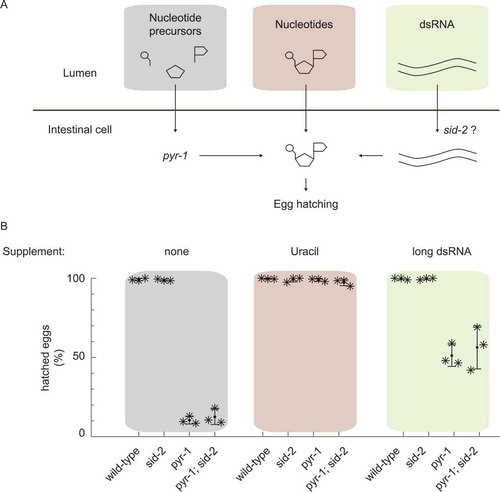
Figure 2. Sid-2 mutant animals grow faster and are elongated at hatching
A) Growth curve visualizing body length during development for wild type (n = 20) and sid-2(qt142) (n = 31), sid-2(mj465) (n = 33) mutants, lines represent medians and error-bars represent the 95% confidence interval of the median. B) Gardner-Altman plot for generation time of C. elegans wild type and indicated mutant animals. Top: Dots represent generation time for individual animals. Bottom: Dots indicate the mean difference in generation time between wild type and indicated condition. The 95% confidence interval of the mean difference is indicated by the black lines. Aggregate data from the three grow curve experiments per genotype is shown (wild type n = 17, sid-2(qt142) n = 30, sid-2(mj465) n = 31). C) Gardner-Altman plot for body length at hatching of C. elegans wild type and indicated mutant animals. Top: Dots represent body length at hatching of individual animals. Bottom: Dots indicate the mean difference in body length between wild type and indicated condition. The 95% confidence interval of the mean difference is indicated by the black lines. Aggregate data from at least three experiments per genotype is shown (wild type n = 150, sid-2(mj465) n = 196, sid-2(mj465);myo2:Cherry n = 184, sid-2(mj465); myo2:Cherry;sid-2rescue n = 182).D) Gardner-Altman plot for body length at hatching of C. elegans offsprings of indicated mating experiment. Top: Dots represent body length at hatching of individual animals. Bottom: Dots indicate the mean difference in body length of the test group. The 95% confidence interval of the mean difference is indicated by the black lines. Aggregate data from three experiments per cross is shown (wild type ⚥ x wild type ♂ n = 179, wild type ⚥ x sid-2(qt142) ♂ n = 188, sid-2(qt142) ⚥ x sid-2(qt142) ♂ n = 220, sid-2(qt142) x wild type ♂ n = 206)
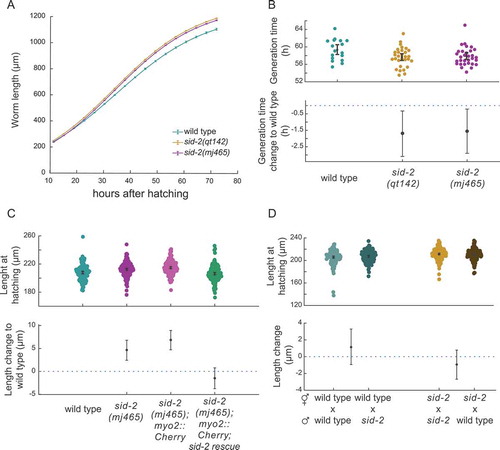
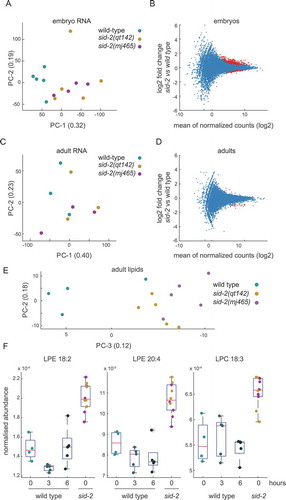
Figure 3. Sid-2 mutants show molecular phenotypes at embryonic and adult stage
A) Principal component analysis representing the embryo transcriptome along the first and second principal component of wild type (n = 5) and sid-2 mutants (total n = 9), sid-2(qt142) n = 4, sid-2(mj465) n = 5). Individual circles represent aggregated transcriptome data of individual biological replicates. B) MA plot visualizing embryo transcriptome comparison of wild type (n = 5) and sid-2 mutants (total n = 9, sid-2(qt142) n = 4, sid-2(mj465) n = 5). Each red circle represents a statistically significant (DE) transcript (FDR < 0.01).C) Principal component analysis representing the adult transcriptome along the first and second principal component of wild type (n = 3) and sid-2 mutants (total n = 3), sid-2(qt142) n = 3, sid-2(mj465) n = 5). Individual circles represent aggregated transcriptome data of individual biological replicates. D) MA plot visualizing adult transcriptome comparison of wild type (n = 3) and sid-2 mutants (total n = 6, sid-2(qt142) n = 3, sid-2(mj465) n = 3). Each red circle represents a statistically significant (DE) transcript (FDR < 0.01). E) Principal component analysis representing the adult lipid metabolome along the second and third principal component of wild type (n = 4) and sid-2 mutants (total n = 10), sid-2(qt142) n = 5, sid-2(mj465) n = 5). Individual circles represent aggregated lipid metabolome data of individual biological replicates. F) Boxplot of lipid metabolites that are significantly different between sid-2 mutant (total n = 10, sid-2(qt142) n = 5, sid-2(mj465) n = 5) and wild type (n = 4–5) samples at all three timepoints (50, 53 and 56 hours after L1 starvation) (T-test, FDR < 0.05). Individual circles represent lipid levels of individual biological replicates. LPE: lysophosphatidylethanolamine, LPC: lysophosphatidylcholine.
Supplemental material
Supplemental Material
Download Zip (19.2 MB)Availability of data
Sequencing data is available in the European Nucleotide Archive under the study accession number PRJEB32813.