Figures & data
Figure 1. Expression of aptamer-tagged trans-sRNAs in S. meliloti. (A) Schematics (drawn to scale) of the genetic constructs to express the MS2/MS2*-tagged AbcR2, NfeR1 and EcpR1 sRNAs, and the Term control from an engineered constitutive Plac’ promoter. The expected length (nt) of the RNA species derived from each construct is indicated. The arrowhead indicates the processing site of the full-length EcpR1 wild-type transcript. Sites used for cloning were BamHI (B), XbaI (X) and HindIII. (B, C, and D) Northern blot detection of aptamer-tagged sRNAs. Total RNA from strain SmhfqFLAG transformed with either pSRK-MS2-Term, pSRKMS2/MS2*-AbcR2, pSRKMS2/MS2*-NfeR1 or pSRKMS2/MS2*-EcpR1, was probed with specific oligonucleotides targeting AbcR2 (A), NfeR1 (B) and EcpR1 (C), respectively. The detected RNA species and their length (nt) are indicated to the left of each panel. 5S rRNA was probed as RNA loading control. Lanes: 1, MS2-Term-expressing cells; 2, bacteria expressing the corresponding MS2-tagged sRNA; 3, bacteria expressing MS2*-tagged sRNA. Expression of wild-type endogenous sRNAs was induced by growth of bacteria in MM to log phase (NfeR1) or by an osmotic upshift (AbcR2 and EcpR1)
Figure 2. Identification of proteins associated with the sRNAs. (A) Heatmap representation of protein abundance as revealed by MS. Columns refer to the different pSRK-MS2-sRNAs used for these experiments and the respective controls, rows represent individual proteins. For visualization purposes, the white-blue colour bar represents the number of peptides identified for the corresponding proteins. (B) Venn diagram showing the overlap of all identified proteins within tagged-sRNAs and all control samples. (C) Heatmap representation of enriched GO terms (rows) from comparative GO [Citation72] among proteins exclusively present in the MS2-sRNA samples indicated in the columns. The red-blue colour bar represents the degree of enrichment (p-value) for the described GO terms in the samples obtained by hypergeometric test when considering the 6,177 genes of S. meliloti 1021 strain annotated in the GO database as the background set
![Figure 2. Identification of proteins associated with the sRNAs. (A) Heatmap representation of protein abundance as revealed by MS. Columns refer to the different pSRK-MS2-sRNAs used for these experiments and the respective controls, rows represent individual proteins. For visualization purposes, the white-blue colour bar represents the number of peptides identified for the corresponding proteins. (B) Venn diagram showing the overlap of all identified proteins within tagged-sRNAs and all control samples. (C) Heatmap representation of enriched GO terms (rows) from comparative GO [Citation72] among proteins exclusively present in the MS2-sRNA samples indicated in the columns. The red-blue colour bar represents the degree of enrichment (p-value) for the described GO terms in the samples obtained by hypergeometric test when considering the 6,177 genes of S. meliloti 1021 strain annotated in the GO database as the background set](/cms/asset/57f13dc4-fb16-42aa-a54f-d9a9ac11f33f/krnb_a_1829365_f0002_oc.jpg)
Figure 3. In vivo confirmation of specific sRNA-protein complexes. Agarose gel showing RT-PCR products for detection of sRNAs (right) in CoIP-RNA eluates of the indicated FLAG-tagged proteins or FLAG negative control (top). cDNA synthesized from total RNA isolated from stationary cells grew in TY or MM was used as positive control of sRNA expression. Length (bp) of the PCR products is indicated to the left
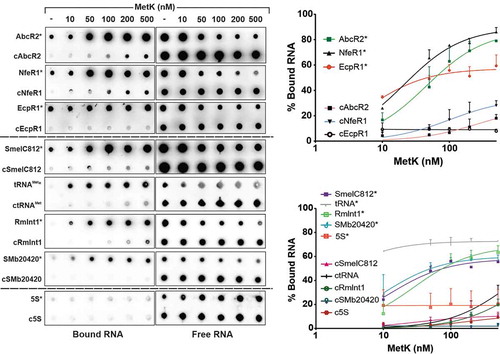
Figure 4. In vitro analysis of MetK-RNA interactions. Dot-blot assays to test binding of MetK to AbcR2, NfeR1, EcpR1, SmelC812, tRNAMet, RmInt1, SMb20420 and 5S RNA species. Radiolabelled transcripts (*) alone (1 nM) or with a molar excess of the corresponding cold RNA (cRNA; 100 nM) were incubated with increased concentrations of purified MetK as indicated on top of the panel. RNA-protein complexes and free RNA were collected by blotting of the reaction mixtures on nitrocellulose (left) and PVDF (right) membranes, respectively. Signal intensities were plotted in the graphs shown to the right. Binding affinities (KD values) quoted in the text were calculated from data of three (in some cases four) independent experiments