
Figures & data
Figure 1. Definitions and criteria for identification of genes and transcripts with significant DE, DAS and DTU. The lines in the expression profile plots depict the average gene and transcript expression changes between two conditions C1 and C2. Total gene expression (blue) is the sum of the expression of all individual transcripts (red, green or yellow). The percentage values represent the expression ratios of transcripts to the gene. A) DE genes and transcripts are those whose abundance changes between conditions, as measured by changes in log2 fold change (L2FC). B) DAS genes must have more than one transcript and are determined by comparing the expression changes between individual transcripts to the gene level between conditions. The change in percentage spliced (ΔPS) is calculated as the percentage change in the abundance of a transcript compared to the total expression from gene. For a gene to be DAS, besides a pre-set p-value cut-off, at least one transcript must have a ΔPS ≥0.1. C) DTU transcripts are those transcripts which show different expression behaviour from the other transcripts of the same gene. They are determined by comparing the change in expression of each transcript to the average expression change of all the remaining transcripts of the gene. With these criteria, A) DE only genes are those where the gene and transcript expression levels change significantly but transcripts do not change their relative abundance within a gene. B) DAS only genes are those where the gene expression level does not change significantly but that of at least one transcript changes its relative abundance within a gene. C) DE+DAS genes show both significant gene-level expression changes and relative abundance changes of at least one transcript. Isoform switches [ISs) happen when a pair of transcripts reverse their relative abundance across different conditions or time points
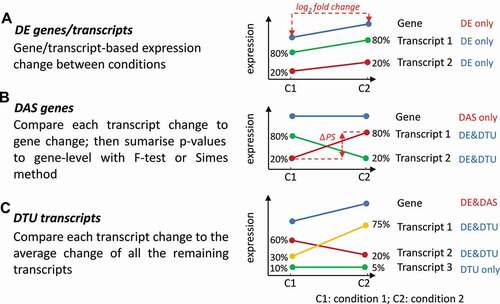
Figure 2. 3D RNA-seq analysis pipeline
Figure 3. Illustrations of visualization outputs from 3D RNA-seq. A) Summary figure of expressed genes and significant DE, DE+DAS and DAS genes from analysis of the Arabidopsis data; B) Summary figure of expressed transcripts and DE, DE+DTU and DTU transcripts; C) Number of significantly up- and down-regulated DE genes in different contrast groups, and D) Number of significant isoform switches in contrast groups. E) Volcano plot of significant DE genes. The top 10 genes with the smallest p values and biggest fold changes are highlighted and different colours refer to different contrast groups
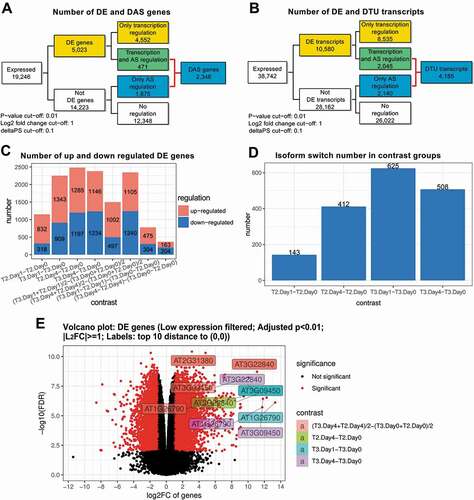
Figure 4. Visualization of clustered genes and transcripts and enriched GO terms. Heatmaps show the grouped expression profiles for A) DE genes and B) DTU transcripts across the samples. The top-enriched GO terms for C) DE and D) DAS genes are visualized with their associated FDRs
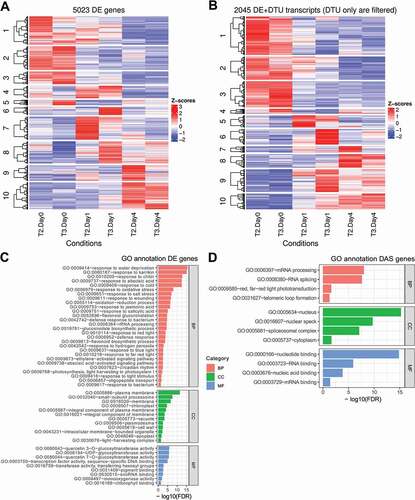
Figure 5. Comparison of the gene lists generated by 3D RNA-seq and Sleuth pipelines. The RNA-seq data on dexamethasone treatment of mice cells was taken from Citation9. Comparable parameters were applied when running 3D RNA-seq and Sleuth. The Venn diagram compares the DE genes from Sleuth to DE and DAS genes and DE and DTU transcripts from 3D RNA-seq
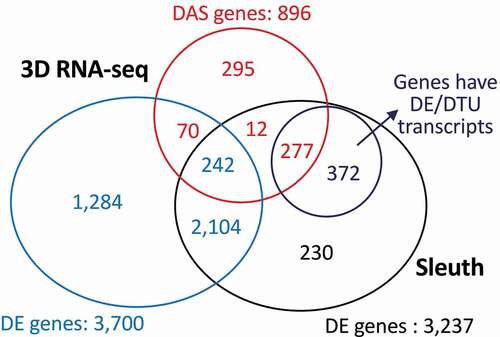
Figure 6. Top-enriched GO terms identified from 3D RNA-seq and Sleuth. The Fisher’s exact test and topGO R package were used to generate significant enrichment gene ontology (GO] terms with FDR < 0.05. Significant terms relevant to response to stress, immune system, inflammation, hormone response, splicing/spliceosome are shown in the figure. A) Significantly enriched GO terms of DE genes from Sleuth; B) Significantly enriched GO terms of DE genes from 3D RNA-seq; C) Significantly enriched GO terms of DAS genes from 3D RNA-seq; and D) Significantly enriched GO terms of novel DE genes unique to 3D RNA-seq. Splicing/spliceosome-related GO terms are enriched in the DE genes in Sleuth (red dashed box in A) but are found in GO terms associated with DAS genes in 3D RNA-seq (C). BP: Biological process; BP_splice: Biological process with terms of splice, splicing, spliceosome and spliceosomal; CC: Cellular Component; MF: Molecular Function
![Figure 6. Top-enriched GO terms identified from 3D RNA-seq and Sleuth. The Fisher’s exact test and topGO R package were used to generate significant enrichment gene ontology (GO] terms with FDR < 0.05. Significant terms relevant to response to stress, immune system, inflammation, hormone response, splicing/spliceosome are shown in the figure. A) Significantly enriched GO terms of DE genes from Sleuth; B) Significantly enriched GO terms of DE genes from 3D RNA-seq; C) Significantly enriched GO terms of DAS genes from 3D RNA-seq; and D) Significantly enriched GO terms of novel DE genes unique to 3D RNA-seq. Splicing/spliceosome-related GO terms are enriched in the DE genes in Sleuth (red dashed box in A) but are found in GO terms associated with DAS genes in 3D RNA-seq (C). BP: Biological process; BP_splice: Biological process with terms of splice, splicing, spliceosome and spliceosomal; CC: Cellular Component; MF: Molecular Function](/cms/asset/a07eef80-d41f-45c3-9edb-e3b73ffb6df2/krnb_a_1858253_f0006_c.jpg)
Figure 7. Sex-specific and tissue-specific expression analysis using 3D RNA-seq on the mouse data. Contrast groups were designed to investigate Dex-induced expression and alternative splicing changes between male and female and cortex and hypothalamus brain regions. Significant DE gene/transcript lists were generated by BH adjusted p-value < 0.05, and
0.1. A) Up- and down-regulated DE genes and B) DE transcripts. C) Summary of statistical analysis results from 3D RNA-seq in each contrast group. D) Venn diagram comparing the DE genes in the 3D RNA-seq analysis to the results in Frahm et al. [Citation9], in which the significant DE genes were determined by p-value < 0.05 (multiple testing adjustment and
cut-off were not applied). 92 genes had low expression and were not included in the transcriptome quantification in 3D RNA-seq analysis. E) the number of Isoform switches in different contrast groups with the following cut-offs: probability of switch
0.5, difference of average TPMs at different conditions
1 TPM and adjusted p-value of the TPM difference < 0.05
![Figure 7. Sex-specific and tissue-specific expression analysis using 3D RNA-seq on the mouse data. Contrast groups were designed to investigate Dex-induced expression and alternative splicing changes between male and female and cortex and hypothalamus brain regions. Significant DE gene/transcript lists were generated by BH adjusted p-value < 0.05, L2FC≥1 and ΔPS≥ 0.1. A) Up- and down-regulated DE genes and B) DE transcripts. C) Summary of statistical analysis results from 3D RNA-seq in each contrast group. D) Venn diagram comparing the DE genes in the 3D RNA-seq analysis to the results in Frahm et al. [Citation9], in which the significant DE genes were determined by p-value < 0.05 (multiple testing adjustment and L2FC cut-off were not applied). 92 genes had low expression and were not included in the transcriptome quantification in 3D RNA-seq analysis. E) the number of Isoform switches in different contrast groups with the following cut-offs: probability of switch ≥ 0.5, difference of average TPMs at different conditions ≥ 1 TPM and adjusted p-value of the TPM difference < 0.05](/cms/asset/e76dd434-8a28-4e3e-8a22-bb9ac5398265/krnb_a_1858253_f0007_c.jpg)
Supplemental Material
Download MS Word (1.6 MB)Data availability statement
The 3D RNA-seq web interface is available at https://3drnaseq.hutton.ac.uk. The R package version (ThreeDRNAseq) is available on Github at https://github.com/wyguo/ThreeDRNAseq.
Manuals for both versions and transcript quantification on Galaxy interface can be accessed from https://github.com/wyguo/ThreeDRNAseq/tree/master/vignettes/user_manuals
Tutorial and demo video can be viewed from https://www.youtube.com/watch?v=rqeXECX1-T4
The Kallisto transcript quantifications from the dexamethasone treatment on mice were downloaded from:
https://figshare.com/articles/kallisto_quantifications_of_Frahm_et_al_2017/6203012.
The Sleuth/aggregated p-values pipeline is at:
https://pachterlab.github.io/sleuth_walkthroughs/pval_agg/analysis.html.