
Figures & data
Figure 1. Structural organization of M5. (A) 1D 1H NMR spectra for three constructs of M5 NTD: residues 1–80 (left), 1–110 (middle), and 1–113 (right) showing that only the construct spanning residues 1–113 is folded. (B) Structure of the M5 NTD zoomed on the additional α-helix (α4: residues 100–109). A residue within (R104), and just after the helix (Y111) form hydrogen bonds to residues in other structural elements (A21 and E5-to-K76, respectively), stabilizing the Toprim domain structure. These hydrogen bonds are shown in black dots. (C) Schematic and structural outline of M5 domains comprising an extended N-terminal Toprim domain (NTD), a linker region and a C-terminal RNA-binding domain (CTD). Secondary structure elements are indicated on the M5 structure taken from the cryoEM structure of M5 bound to the 50S (pre5S) particle (PDB 6TPQ). (D) Native mass spectrum of full-length M5 showing that the protein is a monomer with a molecular mass of 20,989 ± 1 Da corresponding to its precise theoretical molecular mass
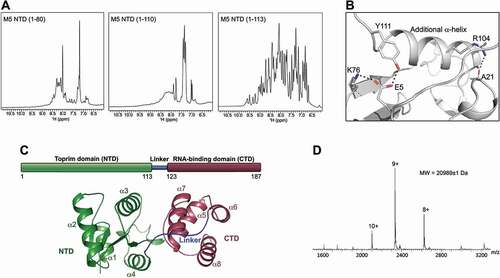
Figure 2. Metal binding in the M5 N-terminal domain. (A) Plot of melting temperature (Tm) of the N-terminal domain (NTD) of M5 in the absence or presence of Mg2+ ions, measured in degrees Celsius (C) from a DSF experiment. Significant difference is indicated by asterisks according to a standard P-test. (B) Electrostatic surface potential view of the M5 NTD co-crystallized with two Mg2+ ions (green spheres) bound in the active site. Water molecules that coordinate the ions are shown as red spheres. Red and blue surfaces indicate negative and positive electrostatic potentials, respectively, while white surfaces represent neutral residues. (C) Electron density maps of the active site in the Mg2+-bound M5 (Mg2+ as green spheres, water molecules as red spheres). The composite difference 2 Fo-Fc density omit map (blue) is contoured at 1.5σ. The difference Fo-Fc omit map (green) for the M5 model refined without the Mg2+ ions in the active site and inner-sphere water molecules is contoured at 5σ. (D) The acidic residues (E10, D14, D56, D58 and E96, stick representation) and water molecules (W, red spheres) in the active site of M5 that participate in binding of the two Mg2+ ions (A and B, green spheres). The octahedral arrangement around metal A and square-planar arrangement around metal B are indicated by outlining the bonds (black dots) to the inner-sphere O-atoms. (E) Superimposition of the Mg2+-bound and apo NTD structures. Residues (D14, D56 D58, E96) that coordinate Mg2+ ions (A, B) are shown as sticks. (F) Superimposition of the Mg2+-bound NTD structure onto the NTD from the RNA-bound M5 model. An O-atom from A117 in the RNA cleavage site is positioned such that it could coordinate a Mg2+ ion (ion B, in Fig. 2B). Substrate pre-5S rRNA is shown in orange with the extensions in yellow. The 3ʹ-cleavage site is indicated
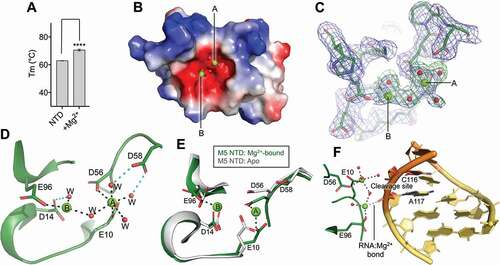
Table 1. Crystallographic data. Processing and refinement statistics for the crystallized RNase M5 NTD
Figure 3. Key residues in M5 active site. (A) Plot of melting temperature (Tm) of the full-length M5 wild-type (WT) or mutant D56A, D58A and D14A protein in the absence or presence of Mg2+ ions, measured in degree Celsius (C) from a DSF experiment. Significantly different samples are indicated by asterisks according to a standard P-test. (B) Northern blot showing removal of 5ʹ- and 3ʹ-extensions from 50S(pre-5S) particles by M5 wild-type (M5WT) (lanes 3–5), and lack thereof by M5D14A mutant protein (lanes 6–8) at different time points. Lanes 1–2 show pre-5S rRNA at the first and last time point in the absence of M5 protein
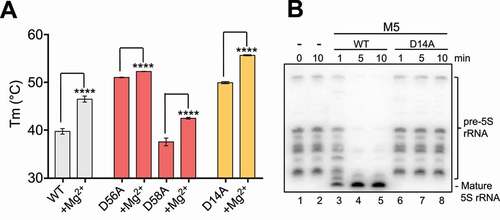
Figure 4. M5 domain interactions. (A) NMR HSQC spectra of full-length M5 (in black) and M5 CTD (in red). The chemical shift variations observed between the two spectra, seen for several resonances, shows interaction between the NTD and CTD. (B) The experimental scattering curve for full-length M5 (black) plotted against the theoretical scattering curve (red) for a representative M5 solution model from each subclass and the RNA-bound M5 structure. The goodness-of-fit (χ2) is indicated. The plot was created using the FoXS server [Citation36]. (C) Five models of full-length M5 in solution calculated from the SAXS data compared to the RNA-bound cryoEM structure (PDB 6TPQ). CTD: dark red, NTD: dark green, Linker: dark blue. The RNA-bound model is taken from the cryoEM model of M5 bound to the 50S ribosomal particle
![Figure 4. M5 domain interactions. (A) NMR HSQC spectra of full-length M5 (in black) and M5 CTD (in red). The chemical shift variations observed between the two spectra, seen for several resonances, shows interaction between the NTD and CTD. (B) The experimental scattering curve for full-length M5 (black) plotted against the theoretical scattering curve (red) for a representative M5 solution model from each subclass and the RNA-bound M5 structure. The goodness-of-fit (χ2) is indicated. The plot was created using the FoXS server [Citation36]. (C) Five models of full-length M5 in solution calculated from the SAXS data compared to the RNA-bound cryoEM structure (PDB 6TPQ). CTD: dark red, NTD: dark green, Linker: dark blue. The RNA-bound model is taken from the cryoEM model of M5 bound to the 50S ribosomal particle](/cms/asset/84b3ba71-a224-4c94-9b08-68bddc11cbb3/krnb_a_1885896_f0004_c.jpg)
Figure 5. Local rearrangements of M5 for 5ʹ-strand cleavage. (A) Heat map of the relative fractional uptake (RFU) differences between free inactive M5D56A and M5D56A bound to the RNP substrate (uL18:pre-5S rRNA) lacking the 3ʹ-extension. The differences are given for the shortest identified peptide for each residue and for all deuteration time-points (0.5 min, 2 min, 10 min, 30 min and 60 min). Each residue is colour-scaled from −20% to +20% of relative fractional uptake (RFU) difference (from blue to red, respectively). (B) Data obtained at the 30 min deuteration time-point shown on the structure of M5 (cartoon representation) extracted from the ribosome-bound M5D58A cryoEM structure (PDB: 6TPQ, EMD-10,543). Residues are coloured in accordance with the HDX-MS data shown in (A) where zones that are significantly protected or deprotected are shown in red or blue, respectively
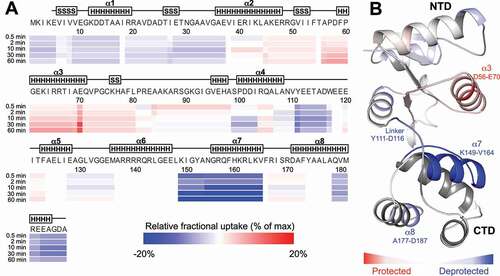
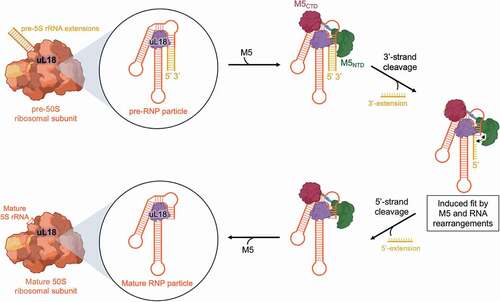
Figure 6. Mechanistic route for pre-5S rRNA maturation by M5. The pre-5S rRNA (orange/yellow) is bound to uL18 (purple) forming the RNP substrate of M5 within the 50S ribosomal subunit. M5 (green/red) recognizes the RNP particle and removes, initially, the 3ʹ-extension. Subsequent induced-fit type rearrangements in both M5 and pre-5S rRNA allows removal of the 5ʹ-extension, to obtain a fully mature 5S rRNA within the 50S ribosomal subunit
Supplemental Material
Download MS Word (13 MB)Data Availability
Atomic coordinates and structure factors for the reported crystal structure of M5 NTD:Mg2+ have been deposited in the Protein Data Bank (PDB) under accession number 6Z2B. HDX-MS data have been deposited in the ProteomeXchange Consortium via the PRIDE partner repository with the dataset identifier PXD019202.