Figures & data
Table 1. The relative expression of MIR210HG, HK-2, PKM2 and miR-125b-5p in tissues
Table 2. MIR210HG and miR-125b-5p expression in different human pancreatic cancer cells
Figure 1. MIR210HG expression and its correlation with pancreatic cancer prognosis (a) The expression of lncRNA MIR210HG between GTEx normal pancreas (n = 171) and GDC-TCGA-PAAD tumour samples (n = 179), according to The Genotype-Tissue Expression (GTEx) project and TCGA-PAAD database. logFC = 2.820. p-value = 5.06E-17. (b) The expression of lncRNA MIR210HG in pancreatic cancer and normal pancreatic tissues, according to GSE16515. LogFC = 1.837, p-value = 4.04E-09. (c) Cases from the GDC-TCGA-PAAD database were divided into two groups using the 0.5 cut-off of MIR210HG expression. The correlation between MIR210HG expression and the overall survival in patients with pancreatic cancer was analysed. (samples having an OS-time of less than 1 month were discarded from analysis to exclude other disease burdens caused death). (d) The expression of lncRNA MIR210HG in the normal pancreatic duct, IPMN-adenoma, IPMN-carcinoma, and invasive cancer originating in IPMN, according to GSE19650. IPMN-adenoma, logFC = 0.068, p-value = 8.89E-01, IPMN-carcinoma logFC = 1.545, p-value = 6.35E-03, invasive cancer originating in IPMN logFC = 2.012, p-value = 4.29E-03, compared to normal pancreatic duct. (e) The expression of lncRNA MIR210HG was examined in 20 paired pancreatic cancer and adjacent non-cancerous tissue samples using RT-qPCR. (f) The expression of lncRNA MIR210HG was examined in a normal hTERT-HPNE cell line and four pancreatic cancer cell lines, Panc-1, BxPC-3, AsPC-1, and MIA PaCa-2, using RT-qPCR. *P< 0.05, **P< 0.01
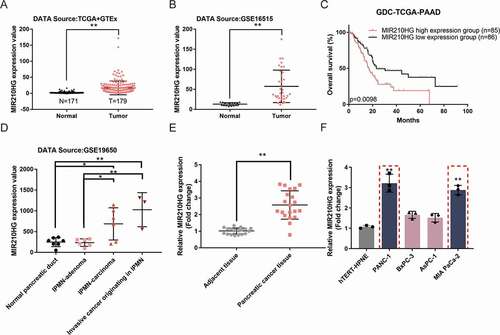
Table 3. Validation of MIR210HG knockdown in pancreatic cancer cells
Table 4. The relative expression of Ki-67 and PCNA in PANC-1 and MIA PaCa-2 cells in response to MIR210HG knockdown
Table 5. The relative protein levels of Ki-67 and PCNA in xenograft mice
Figure 2. Tumour aggression is reduced by knockdown MIR210HG (a) MIR210HG knockdown was achieved in Panc-1 and MIA PaCa-2 cells by transfecting vectors containing short hairpin RNA targeting MIR210HG (sh1/2-MIR210HG); sh-NC was transfected as a negative control. The transfection efficiency was confirmed by RT-qPCR. (b) Then, Panc-1 and MIA PaCa-2 cells were transfected with sh1/2-MIR210HG or sh-NC and examined for cell viability by CCK-8 assay; (c) DNA synthesis capacity (scale bar, 50 µm); (d) cell invasion by Transwell assay; (e) cell migration by Wound healing assay; (f) the cellular protein levels of ki67 and PCNA in no transfected cells (control) and sh1/2-MIR210HG or sh-NC transfected cells were determined by Immunoblotting. (g-h) xenograft mouse tumour model was established in BALB/C nude mice accordingly. sh-MIR210HG lentivirus infected Panc-1 cells were injected under the skin of the left flank of nude mice. Tumour size was measured every 3 days for 27 days; on day 27, mice were sacrificed and the tumour weight was measured (G-H); (i) the protein levels of ki67 and PCNA in xenograft tumour tissues were examined using Immunoblotting. *P< 0.05, **P< 0.01, compared to sh-NC. ## P< 0.01, compared to control
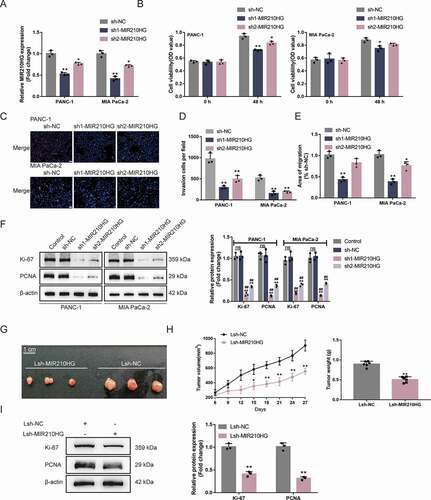
Figure 3. MIR210HG modulates glycolysis-related HK2 and PKM2 and pancreatic cancer cell glycolysis (a) Four datasets, GSE55643, GSE16515, GSE15471 andGSE28735, were used to select differentially expressed genes between normal pancreatic and cancer tissues (|logFC|> 0.56, p < 0.05) and a total of 403 genes were obtained. These differentially expressed genes were applied for KEGG signalling annotation. The differentially expressed genes such as PKM2, ENO2, HK1, and HK2 were enriched in hsa00010 Glycolysis/Gluconeogenesis-Homo sapiens (human). (b) HK2 and PKM2 expression in normal pancreatic and cancer tissues, according to GSE55643. HK2: logFC = 2.037, p-value = 1.56E-05; PKM2: logFC = 1.264, p-value = 2.10E-04 (c) HK2 and PKM2 expression in normal pancreatic and cancer tissues, according to GSE16515. HK2: logFC = 0.166, p-value = 4.62E-02; PKM2: logFC = 1.757, p-value = 2.52E-08. (d) HK2 and PKM2 expression in normal pancreatic and cancer tissues, according to GDC-TCGA-PAAD and GTEx. HK2: logFC = 3.106, p-value = 3.67E-65; PKM2: logFC = 5.110, p-value = 4.51E-38. (e) The expression of HK2 and PKM2 was examined in 20 paired pancreatic cancer and adjacent non-cancerous tissue samples using RT-qPCR. (f) Panc-1 and MIA PaCa-2 cells were transfected with or without sh-MIR210HG and examined for the expression of HK2 and PKM2 using RT-qPCR. (g) Panc-1 and MIA PaCa-2 cells were transfected with or without sh-MIR210HG and examined for the protein levels of HK2 and PKM2 using Immunoblotting. Then, Panc-1 and MIA PaCa-2 cells were transfected with sh-MIR210HG and examined for glucose levels (h), lactic acid levels (i), ATP levels (j), and PDH activity (k). *P< 0.05, **P< 0.01, compared to normal or adjacent tissues group, or sh-NC group. ## P< 0.01, compared to control
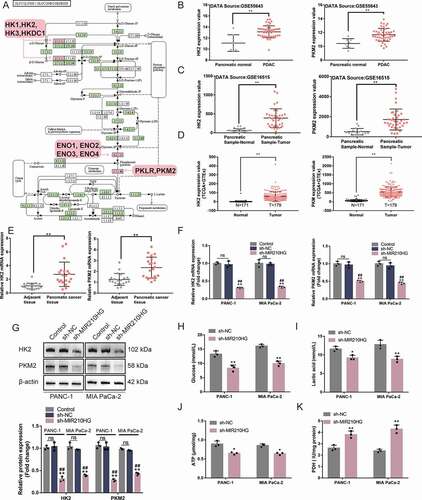
Table 6. The relative mRNA and protein expression of HK2 and PKM2 in response to MIR210HG knockdown
Table 7. The relative expression of miRNAs in different human pancreatic cancer cells
Table 8. Verification of miRNA expression after MIR210HG knockdown
Figure 4. miR-125b-5p directly targets MIR210HG, HK2, and PKM2 (a) A schematic diagram showing the process of selecting miRNAs that might target MIR210HG, HK2 3ʹ-UTR, and PKM2 3ʹ-UTR. miRcode was used to predict miRNAs that might target MIR210HG and miRwalk was used to predict miRNAs that might target HK2 3ʹ-UTR and PKM2 3ʹ-UTR. Two datasets intersected in miR-613, miR-129-5p, and miR-125b-5p. (b) The expression of miR-613, miR-129-5p, and miR-125b-5p was examined in normal hTERT-HPNE and pancreatic cancer Panc-1 and MIA PaCa-2 cells by RT-qPCR. (c) Panc-1 and MIA PaCa-2 cells were transfected with or without sh-MIR210HG and examined for the expression of miR-613, miR-129-5p, and miR-125b-5p by RT-qPCR. (d) The expression of miR-125b-5p was examined in 20 paired pancreatic cancer and adjacent non-cancerous tissue samples using RT-qPCR. (e) The expression of miR-125b-5p was examined in a normal hTERT-HPNE cell line and four pancreatic cancer cell lines, Panc-1, BxPC-3, AsPC-1, and MIA PaCa-2, using RT-qPCR. (f) miR-125b-5p overexpression or inhibition was achieved in Panc-1 and MIA PaCa-2 cells by transfecting miR-125b-5p mimics or inhibitor. The transfection efficiency was confirmed by RT-qPCR. (g-i) Wild-type and mutant-type MIR210HG, HK2 3ʹ-UTR, and PKM2 3ʹ-UTR luciferase reporter vectors were constructed and co-transfected in 293 T cells with miR-125b-5p mimics or inhibitor. The luciferase activity was determined. *P< 0.05, **P< 0.01, compared to sh-NC or mimics NC. ##P< 0.01, compared to inhibitor NC
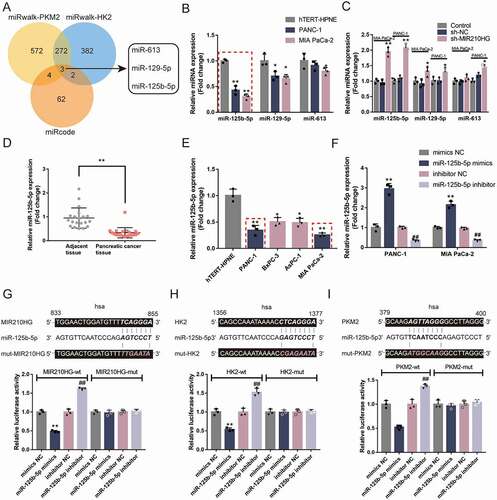
Table 9. Verification of the transfection efficiency of miR-125b-5p knockdown and overexpression in pancreatic cancer cells
Table 10. The relative mRNA and protein expression of HK2, PKM2, ki67, and PCNA in response to miR-125-5p overexpression or knockdown
Figure 5. miR-125b-5p modulates HK2 and PKM2 expression and pancreatic cancer cell phenotypes (a-b) Panc-1 and MIA PaCa-2 cells were transfected with miR-125b-5p mimics or inhibitor and examined for the mRNA expression and protein levels of HK2, PKM2, ki67, and PCNA by RT-qPCR and Immunoblotting. Then, Panc-1 and MIA PaCa-2 cells were transfected with miR-125b-5p mimics or inhibitor and examined for cell viability by CCK-8 assay (c); DNA synthesis capacity (scale bar, 50 µm) (d); cell invasion by Transwell assay (e); cell migration by wound healing assay (f); glucose levels (g), lactic acid levels (h), ATP levels (i), and PDH activity (j). *P< 0.05, **P< 0.01, compared to mimics NC. #P< 0.05, ##P< 0.01, compared to inhibitor NC
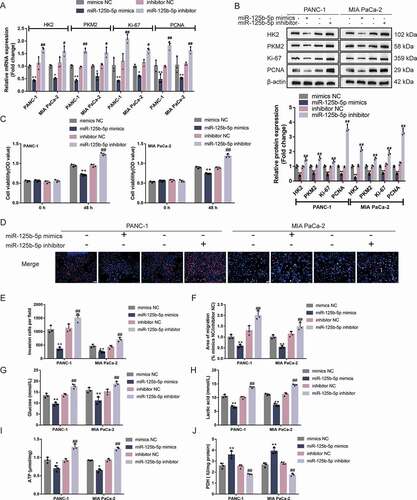
Table 11. The relative mRNA and protein expression of HK2, PKM2, ki67, and PCNA in response to knockdown of MIR210HG and miR-125b-5p
Figure 6. MIR210HG acts on pancreatic cancer cell through miR-125b-5p (a-b) Panc-1 and MIA PaCa-2 cells were co-transfected with sh-MIR210HG and miR-125b-5p inhibitor and examined for the mRNA expression and protein levels of HK2, PKM2, ki67, and PCNA by RT-qPCR and Immunoblotting. Then, Panc-1 and MIA PaCa-2 cells were co-transfected with sh-MIR210HG and miR-125b-5p inhibitor and examined for cell viability by CCK-8 assay (c); DNA synthesis capacity (scale bar, 50 µm) (d); cell invasion by Transwell assay (E); cell migration by wound healing assay (F); glucose levels (G), lactic acid levels (H), ATP levels (I), and PDH activity (J). *P< 0.05, **P< 0.01, compared to sh-NC +inhibitor NC. ##P< 0.01, compared to sh-MIR210HG+miR-125b-5p inhibitor
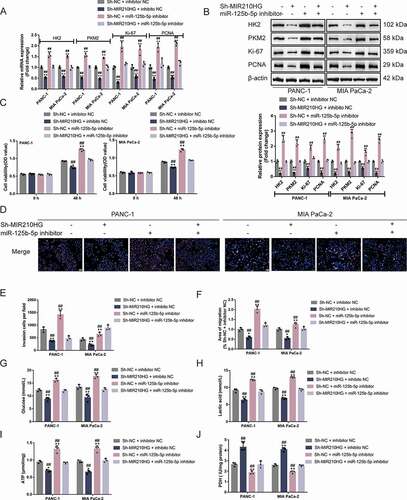
Figure 7. Correlation of MIR210HG/miR-125b-5p/HK2/PKM2 expression in tissue samples. The correlation between MIR210HG and HK2 expression (a), between MIR210HG and PKM2 expression (b), between MIR210HG and miR-125b-5p expression (c), between miR-125b-5p and HK2 expression (d), and between miR-125b-5p and PKM2 expression (e) was analysed using Pearson’s correlation analysis
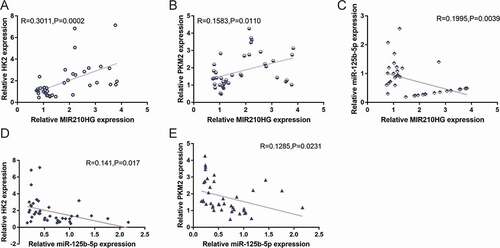
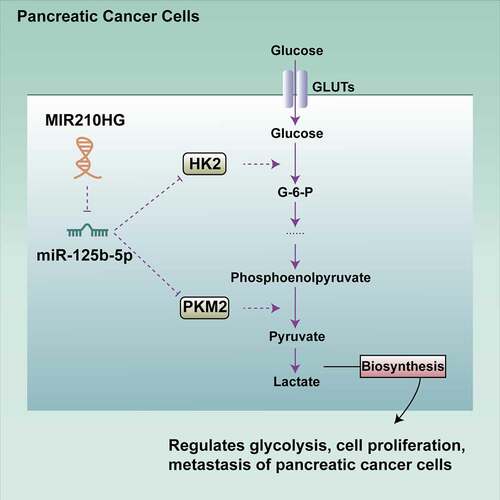
Figure 8. A schematic graph of possible mechanism. MIR210HG could affect the phenotypes of pancreatic cancer cells, including proliferation, invasion, migration, and glycolysis, through the miR-125b-5p/HK2/PKM2 axis