
Figures & data
Figure 1. Preparation of Exp5 and Ran(Q69L) proteins and gel shift assays. (a) Image of a Coomassie blue stained gel containing purified recombinant proteins and known amounts of BSA. Protein markers in kilodaltons (kD) are listed on the left, and the arrow and arrowhead point to Exp5 and Ran(Q69L), respectively. Lane 1: Ran(Q69L); lane 2: Exp5; lanes 3–5: 4, 2, and 1 αg of BSA. (b-f) Gel shift assay results. (b) Gel shift assay testing the binding of a 32P-labelled pre-miR-30 probe to recombinant Exp5 and Ran(Q69L) proteins. Lane 1: pre-miR-30 probe only; lane 2: with Exp5 added; lane 3: with Ran(Q69L) added; lane 4: with both Exp5 and Ran(Q69L) added. The arrow and arrowhead point to the free pre-miR-30 and Exp5-bound pre-miR-30, respectively. (c) Gel shift assays using varying amounts of Exp5 (concentrations indicated on top), with 1 αM Ran(Q69L). The graph on right quantifies the data, with averages, standard deviations, and estimated Kd shown. (d) Competition assays using constant Exp5 but varying amounts of cold pre-miR-30 competitor (concentrations indicated on top). Lane 1: probe only; lanes 2–10: with Exp5 added; lane 2: no competitive RNA; lanes 3–10: with different amounts of competitive RNAs. The graph on right quantifies the data, showing averages and standard deviations of raw Exp5 competition efficiencies (y-axis). (e) Time-dependent influence on Exp5:pre-miR-30 interaction. Exp5 was mixed with 200 nM of cold pre-miR-30 for 15 min, then a 32P-labelled pre-miR-30 was added and incubated for the indicated times. Lane 1: probe only; lanes 2–9: with Exp5 added; lane 2: no competitive RNA; lanes 3–9: with the cold RNA competitor but varying times of incubation with the 32P-labelled pre-miR-30. The graph on right quantifies the data showing the averages and standard deviations of the relative Exp5 binding or competition efficiencies (y-aixs). (f) Competition assays using varying amounts of three different cold pre-miRNAs (concentrations shown on top in nM). Lane 1: probe only; lane 2: with Exp5 added. The graph on right quantifies the data, with averages and standard deviations of the relative binding efficiencies (y-aixs)
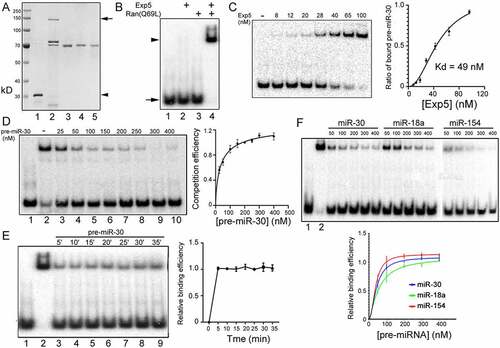
Figure 2. Large scale Exp5 binding experiments. (a) A representative image of pre-miRNAs used in competitive gel shift assays. Pre-miRNAs were synthesized by in vitro transcription, purified, examined by running an aliquot on a denaturing gel, and visualized after ethidium bromide staining. Each lane shows a different pre-miRNA. (b) Representative results of competitive gel shift assays. Cold pre-miRNAs tested are indicated on top of the image. (c) Summary of the relative Exp5 binding efficiencies (y-axis) of 157 pre-miRNAs (x-axis). Averages and standard deviations (in red) are shown
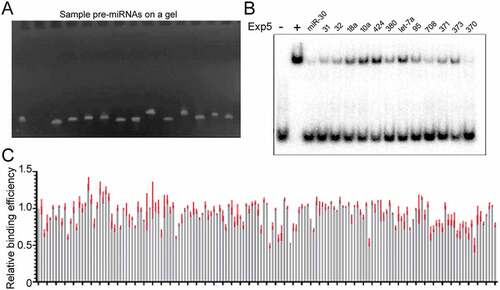
Figure 3. Effects of 3ʹoverhangs on Exp5 binding. (a) Schematics of pre-miRNA sub-structures. Dicer cleavage generates the terminal loop sequence depicted in blue and the miRNA duplex. (b) Length distribution of the predicted 3ʹ overhangs in the 157 pre-miRNAs. (c) Relative Exp5 binding efficiencies (y-axis) of pre-miRNAs with different 3ʹ overhangs. Averages, standard deviations, and P value (Mann-Whitney test) are shown. (d) Competitive gel shift assays with pre-miRNAs that were blunt-ended or contained 2 nt 3ʹ overhangs. Data are summarized in the graph on the right, P value from the paired t-test
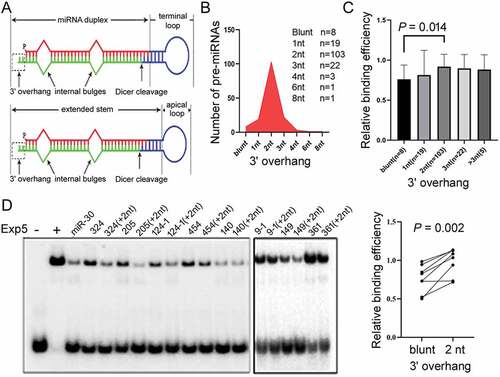
Figure 4. Pre-miRNA features underlying the interactions with Exp5. (a) Impacts of 3ʹ overhang sequences (x-axis) on relative Exp5 binding efficiencies (y-axis). Pre-miRNAs with a 2 nt 3ʹ overhang were examined. (b) Correlation between ∆G of pre-miRNAs (y-axis) with relative Exp5 binding efficiencies (x-axis). Sample size (N), Spearman correlation coefficient (ρ), and P values are listed. (c) Correlation between relative Exp5 binding efficiencies (x-axis) and ∆G of the miRNA duplex, terminal loop region and size of the terminal loop region (y-axes). See ) for pre-miRNA sub-structures. Sample size (n), Spearman correlation coefficient (ρ), and P values are listed. (d) Correlation between relative Exp5 binding efficiencies (x-axis) and ∆G of the extended miRNA duplex, apical loop and size of the apical loop (y-axes). See ) for pre-miRNA sub-structures. Sample size (n), Spearman correlation coefficient (ρ), and P values are listed
Figure 5. Effects of pre-miRNA mutations on Exp5 binding. (a) Competitive gel shift assays with pre-miRNAs containing a bigger or smaller apical loop. Pre-miRNA sequences and predicted secondary structures are shown on the left, and the graph on the right summarizes the data. Averages, standard deviations, and P values from t-tests are indicated in the graph. (b) Competitive gel shift assays with pre-miR-431 and pre-miR-214 variants with or without internal bulges. RNA sequences and predicted secondary structures are listed on the left as well as in (A), and data summarized on right, with averages and standard deviations shown in the graph. Lanes (samples) in the gel image correspond to those in the graph
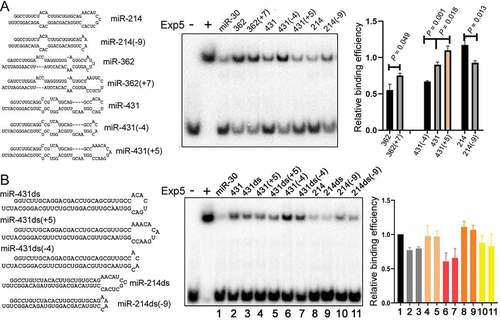
Figure 6. Relation between miRNA expression and pre-miRNA:Exp5 interaction. (a) Correlation between endogenous human miRNA expression (y-axis) and relative Exp5 binding efficiencies (x-axis). Sample size (N), Spearman correlation coefficient (ρ), and P values are indicated. (b) Comparison of the relative Exp5 binding efficiencies (y-axis) of human pre-miRNAs that are conserved in primates only and pre-miRNAs that are conserved in other mammals as well. Numbers of miRNAs in the categories are in the parentheses, and P value from the Mann-Whitney test is indicated. (c) Western blot analyses of Exp5 knockdown by RNAi in 293 T cells. Lane 1: control transfected cells; lane 2: cells transfected with an Exp5 small interfering RNA. Positions of protein markers are indicated in the left. (d) Correlation between miRNA expression changes (y-axis) and relative Exp5 binding efficiencies (x-axis) under the Exp5 RNAi condition. Sample size (n), Spearman correlation coefficient (ρ), and P value are shown
Supplemental Material
Download MS Excel (435 KB)Data availability
The datasets generated during the current study are available in the Gene Expression Omnibus database under the accession number GSE174061.