
Figures & data
Figure 1. An example of hierarchical clustering results of riboswitches. We calculated the similarity matrix of 32 riboswitch structures from 10 riboswitch-containing structures and grouped them by hierarchical clustering. The hierarchical clusters are reported as a tree (or dendrogram). The x axis represents RNA structure ID. The y axis is the distance between two clusters. The dashed line represents the cut-off of clustering
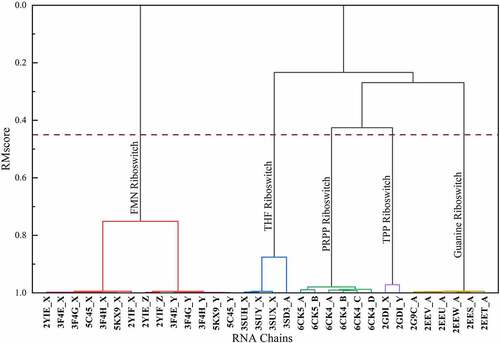
Figure 2. The number of the members in folds. The folds with the number of members less than 30 are not shown
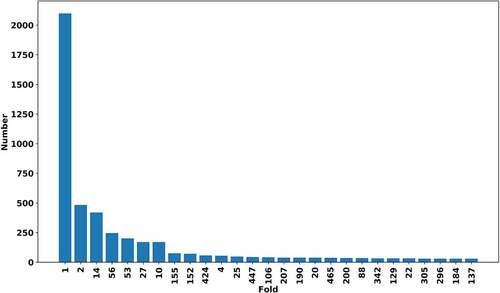
Figure 3. The principal components analysis of similarity matrix from all-to-all RNA structure alignments. The different colour except lightgrey represents different clusters in RR3DD. We coloured the clusters with the number of members more than 50. The fold-14 includes 419 tRNAs. The fold-53 includes 201 23s ribosomal RNAs. The fold-27 includes 170 5s ribosomal RNAs. The fold-56 includes 246 16s ribosomal RNAs. The fold-155 includes 75 guanine riboswitches. RNA fold is determined by a hierarchical clustering algorithm and a similar matrix based on RMscore, which is generated by all-to-all (7466x7466) alignments of RNA with RMalign. The PCA is only used to analysis the distribution of different RNA in PCA space. The PCA analysis reveals that RNAs in the same fold are close to each other in PCA space
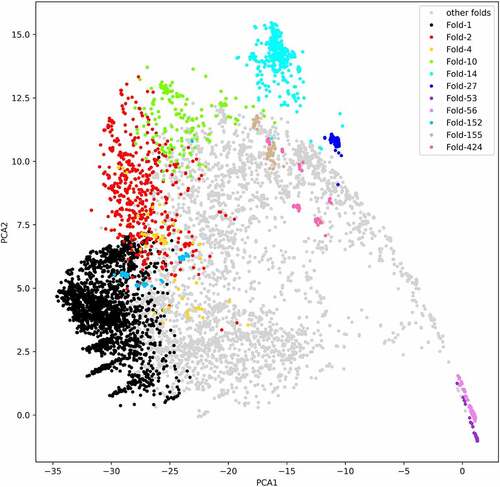
Table 1. Classification of G-quadruplex (43 G-quadruplex containing RNA structures)
Figure 4. The relationship between RNA structure similarity and sequence identity. The sequence identity of the RNA is plotted against the structural similarity in all-to-all pairwise comparison of RNA structures in RR3DD. The RNAs without base-pairing are ignored. The sequence identity is calculated by needle. The RNA structure similarity is measured by RMscore. The lines separate quadrants below and above a sequence (identity = 0.6) and a structure-based threshold (RMscore = 0.45). It indicates that 5.44% RNAs have similar structure with low sequence identity in the second quadrant. 1.02% RNAs are homologs with similar structure and similar sequence. The number of structure-based alignments (with RMScore > 0.45) are 5 (=5.44%/1.02%) times more than that of sequence-based alignments
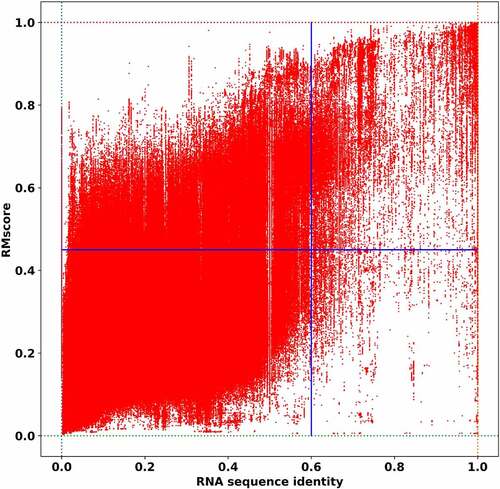
Figure 5. Mapping RNA fold database RR3DD into Rfam. The RNA folds of RR3DD are mapped to Rfam. Top 9 folds with more than 30 members are shown. The x-axis represents the RNA folds. The y-axis represents that the number of the structures in each RNA fold. The same colour belongs to the same families in Rfam. It can be seen that each RNA fold is mapped into several families in Rfam. For example, the Fold-27, Fold-156, Fold-188 and Fold-356 are mapped into one family in Rfam and the Fold-59 is mapped into four families in Rfam. The different fold may perform the same function. For example, both Fold-26 and Fold-55 are mapped into RF02540 (wheat), RF02541 (mintcream) and RF02543 (deeppink) in Rfam. These data come from pdb_full_region.txt in Rfam
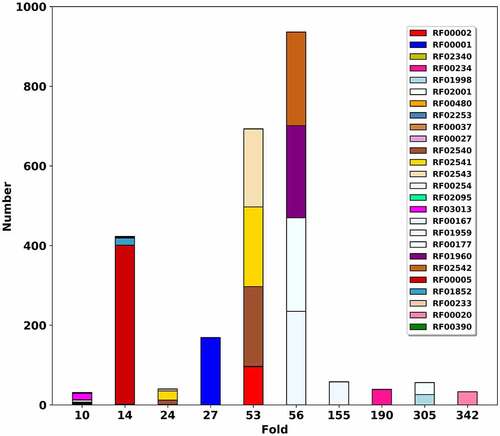
Table 2. The classification of riboswitches