
Figures & data
Figure 1. Flow work of the present study. The Bioinformatics analyses (machine learning and differential expression approaches) (a) together with wet-lab analyses were undertaken for identification, assessment and validation of a set of miRNAs capable of detecting BC at early stages (b). The data of 14 TCGA cancer types and a dataset of blood miRNome (GSE31309) were used as the input data of Bioinformatics analyses. The qRT-PCR method followed by statistical analysis of the results were utilized for final validation of the bioinformatics phase. DF = differentially expressed, miRNA = microRNA, BC = Breast Cancer, qRT-PCR = quantitative real time PCR
Table 1. Characteristics of the BC patients included in this study (a) and normal control group with benign lesion disease or no lesion (b)
Figure 2. miRNAs have the potential to discriminate cancer patients (red) from normal individuals (blue) in 14 studied cancer types. a-n) Principal Component Analysis (PCA) of different cancer types; a) Bladder Urothelial Carcinoma. b) Breast Invasive Carcinoma. c) Oesophageal Carcinoma. d) Head and Neck Squamous Cell Carcinoma. e) Kidney Chromophobe. f) Kidney Renal Clear Cell Carcinoma. g) Kidney Renal Papillary Cell Carcinoma. h) Liver Hepatocellular Carcinoma. i) Lung Adenocarcinoma. j) Lung Squamous Cell Carcinoma. k) Prostate Adenocarcinoma. l) Stomach Adenocarcinoma. m) Thyroid Carcinoma. n) Uterine Corpus Endometrial Carcinoma
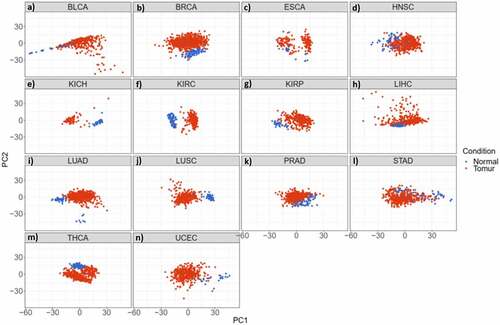
Figure 3. Identification and accuracy assessment of the putative miRNAs as breast cancer biomarkers. a) The curve indicates the accuracy level of detection as increased by the number of miRNAs. While the accuracy of detection increases with the number of miRNAs, it shows a plateau pattern for 4 or more miRNAs. b) Machine learning (ML) method and differential expression (DE) approaches respectively predicted 4 and 17 miRNAs capable of differentiating breast cancer patients from normal individuals. All these miRNAs were differentially expressed in blood samples of breast cancer patients versus blood of healthy individuals, acquired by literature and microarray dataset
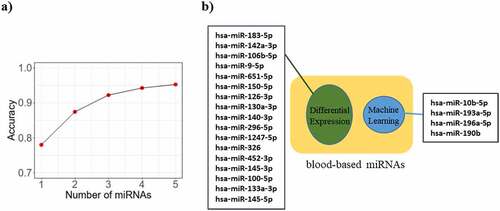
Figure 4. Expression level of 14 miRNAs measured by qRT-PCR in BC patients (n = 70), Benign lesion patients (n = 39), and No lesion individuals (n = 21). P-values < 0.05 were considered as statistically significant results for one-way ANOVA test
Figure 5. Receiver operative characteristic (ROC) and area under curve (AUC). a) ROC curve with single miRNA (hsa-miR-145-5p) in BC group and NC group. b) ROC curve of combination of miRNAs (hsa-miR-106b-5p, −126-3p, −140-3p-193a-5p and −10b-5p) in BC group and NC group. c) ROC curve of miRNAs (hsa-miR-106b-5p, −126-3p, −140-3p-193a-5p and −10b-5p) with demographic information of the patients (Age, marriage status, pregnancy status, number of children, breast feeding history, age of first menstruation, menopause status, familiar history of cancer, personal history of breast and uterine disease and smoking. BC (n = 70) and NC (n = 60)
Supplemental Material
Download Zip (1.2 MB)Data availability
The initial high-throughput datasets are available in The Cancer Genome Atlas (TCGA) and Gene Expression Omnibus (GEO) databases. Moreover, the experimental data are available as Supplementary Table S7. More information are available upon request to Marzieh Lashkari at [email protected] or Mehdi Totonchi at [email protected].