Figures & data
Figure 1. Relationship of Ptiwi proteins and their localization in vegetative cells. A: Phylogenetic tree of Paramecium tetraurelia Ptiwi proteins (blue) in relationship to Tetrahymena Piwis (Twi, red), metazoan Piwi proteins (green) and Agos (yellow). Support values are given at nodes, see Methods for details. The amino acid sequence of the putative pseudogene Ptiwi04 was corrected using its paralog Ptiwi05. B: Localization of Ptiwi proteins in vegetative Paramecium cells injected with Ptiwi13-FLAG (top) or Ptiwi14-FLAG (bottom). Cells were analysed by indirect immunofluorescent staining using custom antibodies directed against Ptiwi13 or Ptiwi14 labelled with secondary Alexa594-conjugated antibody (red). Additionally, the cells were stained using anti-FLAG antibody. Representative overlays of Z-stacks of magnified views are presented. Other panels show DAPI (in blue), brightfield and overlay of DAPI and Alexa594 signal. White asterisk indicates the position of the macronucleus. Scale bar is 10 m and exposure is 2 s
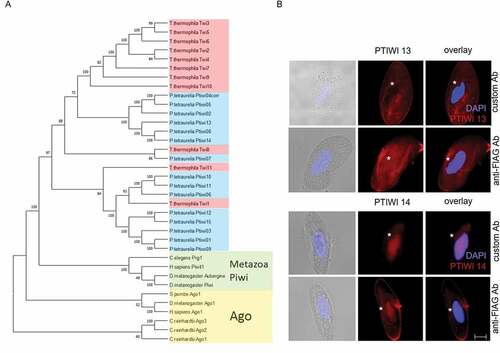
Figure 2. Analysis of sRNAs in Ptiwi immunoprecipitations. A: Experiment overview. A single cell was injected with the pTI-/- transgene. After establishment of a stable line, the cells were injected with FLAG-Ptiwi13/14 constructs, respectively (green). B: Control Western blots for the IPs using anti-FLAG Abs for Ptiwi detection and anti-GFP (Sup.-Supernatant, IP-Immunoprecipitation). Two different setups of the IPs used sonication (S) and douncing (D) for cell lysis, the latter remains MAC structure but permeabilized. C: Total read length distribution of Ptiwi IPed reads after adapter trimming. Average of reads from three IP replicates is shown. D: Relative enrichment of RNA reads in Ptiwi IPs mapping to different categories of genomic templates. Average of reads from three IP replicates was calculated, and the enrichment in reference to individual Ptiwi overexpressing lines is shown. * p-value < 0.005
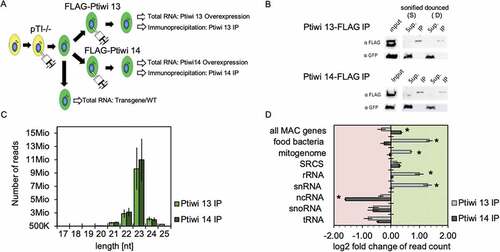
Figure 3. Ptiwi13 and 14 load transgene associated sRNAs. A: Detailed scheme of the endogenous ND169 locus (top) and the truncated transgene (bottom). Introns are numbered and brackets symbolize specific junctions. Shaded regions are not part of the transgene (ND-1 and ND-2). B: Coverage tracks of siRNAs mapped to the endogenous ND169 locus. siRNAs were separated by their direction (sense/antisense). Regions accounted for 1° siRNAs (NDgene, yellow) and 2° siRNAs (ND-1 and ND-2, grey) are highlighted. Coverage track in log scale is shown for one replicate each, while numbers on the right indicate untransformed sense and antisense coverage. C: Read length distribution of 1° siRNAs and 2° siRNAs from Ptiwi IPs and total RNA from pTI-/- injected cells. Data are shown as proportion of reads mapping to the NDgene locus and D: the ND-1 locus. E: Relative enrichment of RNA reads in Ptiwi IPs mapping to different regions of the transgene. Enrichment was calculated for the average of reads of three replicates in reference to individual Ptiwi overexpressing lines. * p-value < 0.005
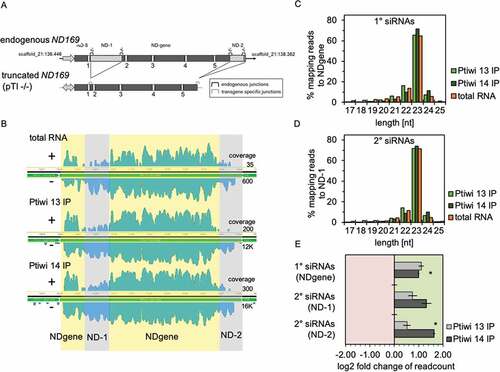
Figure 4. Asymmetric modification and Ptiwi selectivity contributes to accumulation of antisense siRNAs. A: Number of 23nt reads mapping to each indicated genomic feature and transgene regions accounting for 1° and 2° siRNAs were related to the total number of reads of other sizes. Calculation is shown for the mean of Ptiwi IPs and RNA from pTI-/- injected cells as control (total RNA). B: Antisense ratio of reads from Ptiwi IPs calculated by merging three replicates each. C: Difference in the antisense ratio of reads to the antisense ratio of respective control was calculated. Data is shown for reads from knockdown of Ptiwis in duplicates and IPs (triplicates) mapping to the indicated transgene regions. D: Antisense ratio of small RNAs from pTI-/- transgene samples (total RNA, untreated) and small RNAs treated with sodium periodate (+NaIO4). Average of reads from two replicates is shown
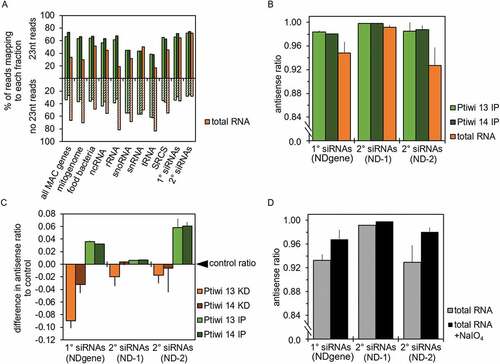
Figure 5. Sequence logos of 1° and 2° siRNAs. A: Sequence logos of 23nt antisense reads from pTI-/- injected cell lines mapping to transgene regions. Logos for either all sequences or the ones without 5ʹ-U are shown. B: Sequence logos of 23nt antisense reads from Ptiwi13 IP (left) and Ptiwi14 IP (right). C: Overlap predictions of small RNAs from 17 to 25nt of untreated, total RNA and the same small RNAs treated with sodium periodate (+NaIO4). Z scores for overlapping pairs are included
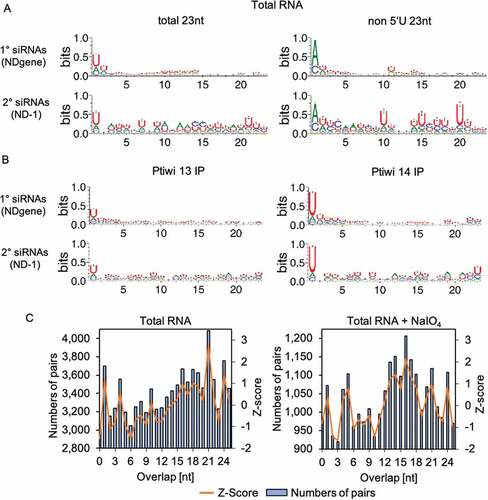
Figure 6. U-content analysis of 23nt sRNAs in Ptiwi IPs. A: Sense/antisense reads from pTI-/- injected cells mapping to indicated regions in 50nt windows. B: Percentage of adenine and uridine of the sense RNA transcript of each region. C: Heatmap of reads mapping to the indicated regions separated by their direction. D: X axis shows U-content of reads found in Ptiwi IPs, while density represents number of reads. In silico data is generated by counting U-content of 23mers of the DNA sequence for each region
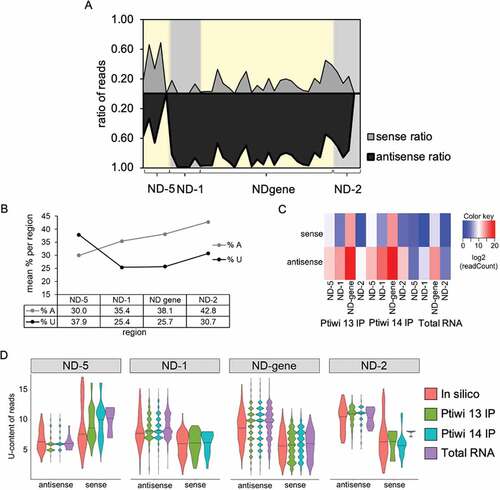
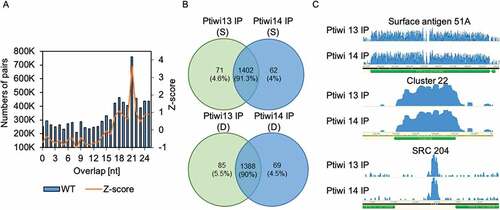
Figure 7. Endogenous sRNAs in Ptiwi IPs. A: Calculation of overlaps of endogenous 17–25nt sRNAs isolated from wildtype RNA including Z-score for overlapping pairs. B: sRNAs mapping to SRCs (small RNA clusters) in the Paramecium genome are analysed by their presence in Ptiwi IPs. Venn diagrams of the two IPs of sonified (S) and dounced (D) lysates with numbers of SRCs detected and the proportion of each fraction of the total found SRCs. C: Three examples of endogenous loci shown by coverage tracks of unnormalized data (surface antigen 51A, cluster22 and SRC 204)