
Figures & data
Figure 1. A) Domain structure of hTUT4. The three CCHC ZnF domains are coloured in Orange, blue and green. the boundaries of the ZnF1, ZnF2 and ZnF3 constructs used in this study are reported using both the full-length hTUT4 amino acid count (black) and, for clarity, the amino acid count of that we use in this manuscript (colours). please note that the ZnF2-3 construct starts at the N-terminal boundary of ZnF2 and ends and the C-terminal boundary of ZnF3. b) [15N 1H] HSQC spectra of CCHC-ZnF2. c) O verlay of the [15N 1H] HSQC spectra of ZnF2 with NNNN RNA at ratios from 1 to 0 (light blue) to 1 to 10 (dark blue). d) S caffold Independent Analysis (SIA) of the hTUT4 ZnF2. left: SIA determines the nucleobase preference of a domain in any wanted position of the bound sequence by comparing the interaction of the domain with four quasi-degenerate RNA sequences, each with one of the four nucleobases in the position to be scanned. A workflow and representative data for this assay are found in Supplementary Figure 1. right: SIA scores for hTUT4 ZnF2. e) l.eft: overlay of [15N 1H] HSQC spectra recorded on ZnF2 with CGGA at protein to RNA ratios from 1 to 0 (light blue) to 1 to 10 (dark blue). I. nset: zoom of the Cys 3 amide resonance. In the inset, the corresponding peaks from equivalent titrations with the CGUA, CUGA RNAs are also displayed. please note that peaks from the other two titrations have been shifted in order to minimize overlap and better appreciate differences in saturation and linewidth. Top right: CSP measured in the CGGA titration plotted against the protein sequence
![Figure 1. A) Domain structure of hTUT4. The three CCHC ZnF domains are coloured in Orange, blue and green. the boundaries of the ZnF1, ZnF2 and ZnF3 constructs used in this study are reported using both the full-length hTUT4 amino acid count (black) and, for clarity, the amino acid count of that we use in this manuscript (colours). please note that the ZnF2-3 construct starts at the N-terminal boundary of ZnF2 and ends and the C-terminal boundary of ZnF3. b) [15N 1H] HSQC spectra of CCHC-ZnF2. c) O verlay of the [15N 1H] HSQC spectra of ZnF2 with NNNN RNA at ratios from 1 to 0 (light blue) to 1 to 10 (dark blue). d) S caffold Independent Analysis (SIA) of the hTUT4 ZnF2. left: SIA determines the nucleobase preference of a domain in any wanted position of the bound sequence by comparing the interaction of the domain with four quasi-degenerate RNA sequences, each with one of the four nucleobases in the position to be scanned. A workflow and representative data for this assay are found in Supplementary Figure 1. right: SIA scores for hTUT4 ZnF2. e) l.eft: overlay of [15N 1H] HSQC spectra recorded on ZnF2 with CGGA at protein to RNA ratios from 1 to 0 (light blue) to 1 to 10 (dark blue). I. nset: zoom of the Cys 3 amide resonance. In the inset, the corresponding peaks from equivalent titrations with the CGUA, CUGA RNAs are also displayed. please note that peaks from the other two titrations have been shifted in order to minimize overlap and better appreciate differences in saturation and linewidth. Top right: CSP measured in the CGGA titration plotted against the protein sequence](/cms/asset/3e63d3e6-c366-45d6-ac48-00e9fdafedfc/krnb_a_1991169_f0001_oc.jpg)
Figure 2. The CCHC ZnF domain binds RNA using different surfaces in different protein-RNA complexes. a) Top: The protein-RNA interaction surfaces in the hTUT4 ZnF2-CGGA (NMR) and hTUT7 ZnF2-UU (X-ray) complexes are mapped in red (top) and yellow (bottom) respectively on the structure of hTUT7, which is here displayed using both a cartoon and surface representation, for clarity of visualization. bottom: the same colour coding is used to map the interactions on the sequence alignment of hTUT4 and hTUT7 ZFs2. b) O verlay of [15 N1 H] HSQC spectra of ZnF2 with UUUU at protein to RNA ratios 1 to 0 (green) and 1 to 10 (dark blue). The region containing the Cys3 and His11 residues has been enlarged. no significant chemical shifts perturbation is observed, indicating the lack of meaningful interactions. c) Top left, and right of this panel: the protein-RNA interaction surfaces in the hTUT4 ZnF2-CGGA and hLin28 ZnF2-AGGAGAU NMR complexes were mapped in red (top) and yellow (bottom) respectively on the structure of hLin28 ZnF2, which is here displayed using both a cartoon and surface representation, for clarity of visualization. Bottom left of the panel: the same colour coding is used to map the residues on the sequence alignment of the two domains. The two residues with the largest chemical shift changes upon RNA binding are the same in the hTUT4 and hLin28 complexes and they are highlighted with a box
![Figure 2. The CCHC ZnF domain binds RNA using different surfaces in different protein-RNA complexes. a) Top: The protein-RNA interaction surfaces in the hTUT4 ZnF2-CGGA (NMR) and hTUT7 ZnF2-UU (X-ray) complexes are mapped in red (top) and yellow (bottom) respectively on the structure of hTUT7, which is here displayed using both a cartoon and surface representation, for clarity of visualization. bottom: the same colour coding is used to map the interactions on the sequence alignment of hTUT4 and hTUT7 ZFs2. b) O verlay of [15 N1 H] HSQC spectra of ZnF2 with UUUU at protein to RNA ratios 1 to 0 (green) and 1 to 10 (dark blue). The region containing the Cys3 and His11 residues has been enlarged. no significant chemical shifts perturbation is observed, indicating the lack of meaningful interactions. c) Top left, and right of this panel: the protein-RNA interaction surfaces in the hTUT4 ZnF2-CGGA and hLin28 ZnF2-AGGAGAU NMR complexes were mapped in red (top) and yellow (bottom) respectively on the structure of hLin28 ZnF2, which is here displayed using both a cartoon and surface representation, for clarity of visualization. Bottom left of the panel: the same colour coding is used to map the residues on the sequence alignment of the two domains. The two residues with the largest chemical shift changes upon RNA binding are the same in the hTUT4 and hLin28 complexes and they are highlighted with a box](/cms/asset/c5209096-3aae-4f09-b7d9-618f904f1d22/krnb_a_1991169_f0002_oc.jpg)
Figure 3. hTUT4 ZnF2-RNA binding using BioLayer Interferometry (BLI). a) Biotinylated RNAs used in the assays. b) Interferograms recorded using Streptavidin sensors coated with the biotinylated RNAs, in buffer and then exposed to increasing concentrations (1 µM, 2 µM, 4 µM and 8 µM) of hTUT4 ZnF2-3 domain. The interferograms are aligned using the buffer baseline. The baseline and the association and dissociation steps are displayed in the top panels. The region used to fit the association curves and to calculate kobs is displayed in the bottom panel. c) Plots of kobs at the different protein concentration. The plots were used to calculate kon and koff, and from those Kd, using the program Anabel
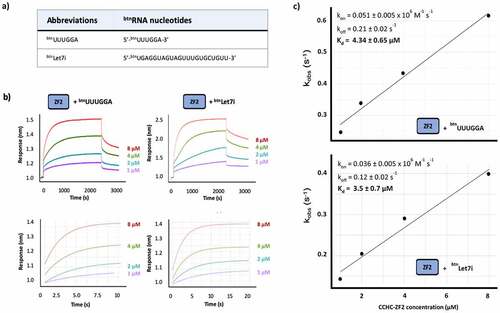
Figure 4. Structural and functional assessment of the coupling between hTUT4 ZnF2 and ZnF3 domains. a) Overlay of [15N 1H] HSQC spectra of ZnF2 (blue), ZnF3 (green) and ZnF2-3 di-domain (black). The organization of the two domains and the boundaries of the three constructs are displayed. b) 15N T1 and T2 and rotational correlation time (τc) values of the ZnF2-3 amides are plotted along the protein sequence. Values for the ZnF2 and for the ZnF3 amides are reported in two separate plots, to better compare the two domains. Residues number refers to the sequence of each domain. c) Plots of Kobs at the different protein concentration. The plots were used to calculate kon and koff, and from those Kd, using the program Anabel
![Figure 4. Structural and functional assessment of the coupling between hTUT4 ZnF2 and ZnF3 domains. a) Overlay of [15N 1H] HSQC spectra of ZnF2 (blue), ZnF3 (green) and ZnF2-3 di-domain (black). The organization of the two domains and the boundaries of the three constructs are displayed. b) 15N T1 and T2 and rotational correlation time (τc) values of the ZnF2-3 amides are plotted along the protein sequence. Values for the ZnF2 and for the ZnF3 amides are reported in two separate plots, to better compare the two domains. Residues number refers to the sequence of each domain. c) Plots of Kobs at the different protein concentration. The plots were used to calculate kon and koff, and from those Kd, using the program Anabel](/cms/asset/707699e2-39cf-4f53-ada2-3bee37ad647c/krnb_a_1991169_f0004_oc.jpg)
Figure 5. A) [15N 1H] HSQC spectra of CCHC-ZnF1. b) Overlay of the [15N 1H] HSQC spectra of ZnF1 free and with a 1:4 protein:NNNN RNA ratio. Zoom region of one ZnF1 residue to confirm spectral alignment and spectra quality. c) Sequence alignment of CCHC-type zinc fingers from hTUT4, HIV-1 nucleocapsid and hLin28 proteins. The ClustalX colour scheme is used to highlight conservation and residue type. In hTUT4 CCHC-ZnF1, two serines substitute bulky residues which are involved in RNA binding in the Lin-28 and Nucleocapside structures. d) Overlay of the [15N 1H] HSQC spectra of CCHC-ZnF3 (left) and CCHC-ZnF3 F1360S/V1368S mutant (right) free (black) and with NNGN RNA at a 1 to 4 ratio (green), which shows how mutating the two serines above impairs RNA binding
![Figure 5. A) [15N 1H] HSQC spectra of CCHC-ZnF1. b) Overlay of the [15N 1H] HSQC spectra of ZnF1 free and with a 1:4 protein:NNNN RNA ratio. Zoom region of one ZnF1 residue to confirm spectral alignment and spectra quality. c) Sequence alignment of CCHC-type zinc fingers from hTUT4, HIV-1 nucleocapsid and hLin28 proteins. The ClustalX colour scheme is used to highlight conservation and residue type. In hTUT4 CCHC-ZnF1, two serines substitute bulky residues which are involved in RNA binding in the Lin-28 and Nucleocapside structures. d) Overlay of the [15N 1H] HSQC spectra of CCHC-ZnF3 (left) and CCHC-ZnF3 F1360S/V1368S mutant (right) free (black) and with NNGN RNA at a 1 to 4 ratio (green), which shows how mutating the two serines above impairs RNA binding](/cms/asset/35eb03c4-f9db-4aa5-bf71-b04fd6e4d63d/krnb_a_1991169_f0005_oc.jpg)