
Figures & data
Figure 1. Interaction between PCBP2 and mouse utrophin-A 5ʹUTR.
(A) RNA-IP confirms in vivo interaction between PCBP2 and utrophin-A 5ʹUTR. Utrophin-A and luciferase-specific RT-PCR products were detected only in the PCBP2-immunoprecipitated set. Utrn: Utrophin, Luc: Luciferase. (B) Schematic diagram of 5′Luc and pCDEL. (C) ITC thermogram of Protein-RNA interaction at 25°C. The upper panel shows the amount of heat generated per sequential injection of RNA into protein and the bottom panel shows the integrated heat data after correction of heat of dilution against the mole ratio. The solid line indicates the best fitted curve. (D) Thermodynamic parameters as determined by ITC experiment.
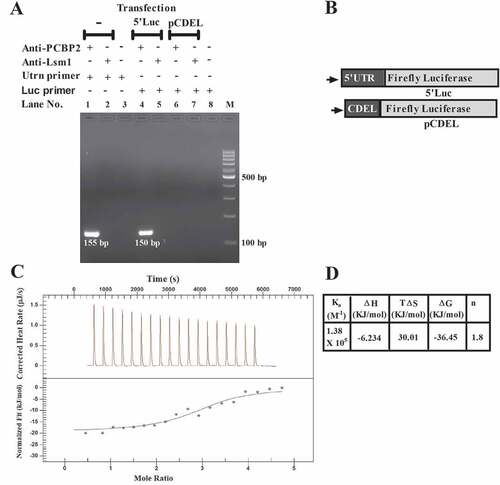
Figure 2. PCBP2 is a modulator of utrophin-A expression.
(A) Expression of utrophin-A and PCBP2 mRNA upon transfection of pcDNA-pcbp2, pBSU6-psi2 and corresponding empty vectors as determined by qPCR (n = 3). (B), (C) and (D) show representative Western blots and quantified protein levels of utrophin-A and PCBP2 upon overexpression and silencing of PCBP2 in C2C12 cells (n = 3). Western blot images presented in (B) were analysed using ImageJ software. (E) Schematic presentation of reporter constructs: pGL3-Control, 5ʹLuc, pCDEL and pRL-TK. (F) Bar diagram representation of luciferase assay (n = 6). In (A), (C), (D) and (F), data are presented as mean ± SD. *** p < 0.001, * p < 0.05 (Student’s t-test).
Figure 3. Interaction between PCBP2 and utrophin-A 5ʹUTR helps in the retention of utrophin-A transcript within the nucleus.
(A) Purity of nuclear (NF) and cytosolic (CF) fractions from three different preparations was checked with Western blot. (B) The abundance of utrophin-A and β-actin mRNAs in the nuclear and cytosolic fractions was determined. The nuclear to cytosolic abundance of a transcript is defined as 2−ΔΔCT, where ΔΔCT = [(CT Nuclear (Target) – CT Nuclear (GAPDH)) – (CT Cytosolic (Target) – CT Cytosolic (GAPDH))]. (C) The nuclear to cytosolic abundance of reporter mRNAs was plotted for each set. (D) Schematic presentation of the reporter expression cassette in PolyC-NcoI. Construct PolyC-NcoI has poly C stretch from mouse utrophin-A 5ʹUTR at the upstream of firefly luciferase ORF in the pGL3-Control vector. (E) The nuclear to cytosolic abundance of mRNA from PolyC-NcoI was determined from each set and plotted. In A, B and D, results are plotted as mean ± SD (n = 3). *** p < 0.001, ** p < 0.01 (Student’s t-test).
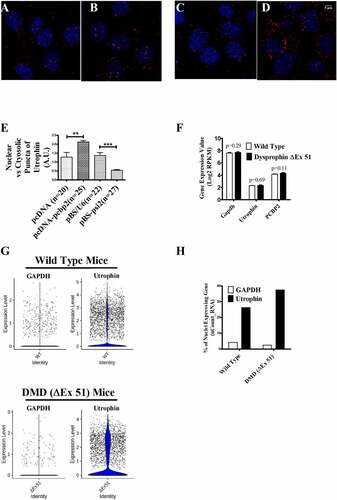
Figure 4. Localization of utrophin-A transcript in C2C12 cells and transcriptomic analysis of TA muscle from WT and DMD (ΔEx51) mice.
(A), (B), (C) and (D) show the representative RNA FISH images of pcDNA, pcDNA-pcbp2, pBS/U6 and pBS-psi2-transfected C2C12 cells. The scale bar is set to 5 µm. (E) Graphical representation of the nuclear vs cytosolic puncta ratio of utrophin-A. (F) Log2 RPKM values from RNA-seq data (GSE156496) of TA muscles from WT and DMD mice. (G) Violin plot of GAPDH and utrophin gene from single nuclear RNA-seq data (GSE156497) of TA muscle from WT mice (upper panel) and DMD mice (lower panel), where each dot represents the single nuclei and the blue shape shows the distribution of gene expression data. (H) Normalized quantitation showing the percentage of nuclei expressing GAPDH and utrophin gene from snRNA-seq data of TA muscle from WT and DMD mice. The result is plotted as mean ± SD. *** p < 0.001, ** p < 0.01 (Student’s t-test).
Supplemental material