
Figures & data
Figure 1. A) Bioinformatic workflow of the ACE2 and thrombosis-related seed genes selection for the integration of PPI interactome data with co-expression networks by NERI algorithm. This analysis enabled us to focus on a specific part of the network in this case: gradual signalling cascade between ACE2 and genes associated with coagulation-related processes. Seed genes are marked in green. Nodes outside of the ACE2 network were sorted using group circular layout based on the number of occurrences on four thrombosis and coagulation- related gene lists. Node colours were related to so-called ‘coagulation score’ calculated based on the occurrences on four gene lists and expression in four cardiovascular-system related tissues. B) Bioinformatic workflow leading to the identification of the miRNAs regulating the coagulation process in coronavirus infection.
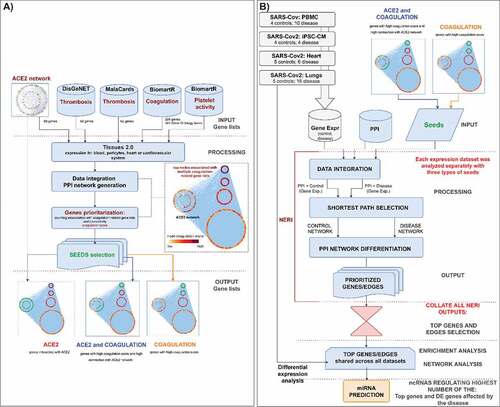
Figure 2. Top nodes identified by NERI algorithm as associated with coagulation networks in SARS and SARS-CoV-2 infections. The edge size is related to the number of occurrences in the top 30% of strongest regulated edges across analysed datasets (SARS, cardiomyocytes, lungs, heart) and two types of seeds ‘ACE2 and coagulation’ and ‘coagulation’ (8 gene lists in total). The node and edge sizes are associated with the importance in signal flow within the network for the analysed expression datasets (12 in total), which does not necessarily relate to upregulation in expression. If node/edge was enhanced according to NERI in higher number of disease-related datasets, it has red colour and has high importance in disease, if in control-related dataset, it is green and has decreased importance in disease. Grey colour means disease or control rate was the same in all datasets. The node size is associated with the sum of Δ’ (S) scores obtained from NERI. The higher the S score, the more important the role of a given gene in the analysed network. To show the tissue-specific expression level of each gene we added bars on each node reflecting their expression confidence (0–5) using the data obtained from the Tissues 2.0 database. EGFR, ELAVL1 and APP were identified across all 12 analysed gene lists (including three sets of seeds) as the top regulators of the thrombosis-related networks. DE genes in expression datasets have blue borders.
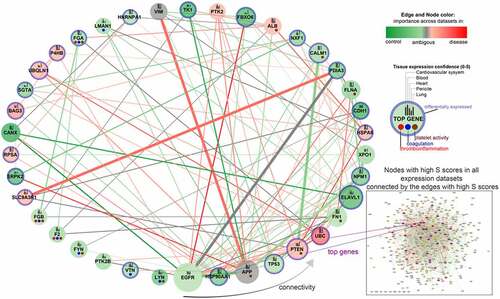
Figure 3. A) Top 25 enriched pathways associated with top nodes identified by NERI algorithm as important in coagulation networks in SARS and SARS-CoV-2 infections. Grey dots indicate whether a gene is present within significantly enriched signalling pathways. It is worth noticing that CALM1 was present in the highest number of signalling pathways as an important ACE2 interactor. The top interactors with highest number of associated pathways were ordered in decreasing manner from left to right. B) Alterations between CALM1 interactors in COVID-19. Green colour is associated with loss of importance in disease which can lead to switching the signalling onto neighbouring nodes. Red colour is associated with increased importance of the node/edge in disease, leading to increase of signalling in a given part of the network.
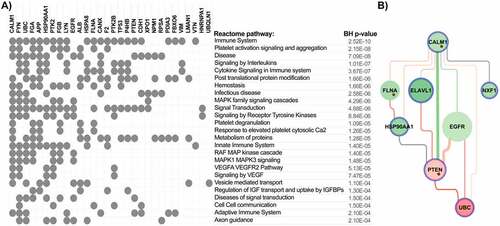
Table 1. The top miRNAs which regulate ACE2-Coagulation related interaction networks. Top miRNAs were identified based on their regulation of highest number of the top differentially expressed genes (DE) across all analysed datasets, top DE genes associated with coagulation across all analysed datasets, top genes identified by NERI analysis, and top genes identified by NERI analysis and also involved in coagulation process. Additionally we showed whether miRNA was targeting ELAVL1 or EGFR gene (not present on complete coagulation gene list). Mature miRNAs marked with bold font were examined using qPCR.
Table 2. Participant’s characteristics.
Table 3. Patients characteristics.
Figure 4. Comparison of circulating miRNAs relative expression between the groups. a) miR-16-5p; b) Let-7b-5p; c) miR-27a-3p; d) miR-155-5p. Mann-Whitney U test and Wilcoxon test were used appropriately. Kruskal-Wallis test shows the difference among the four groups. MiRNAs expression data is presented as log10 transformation. Abbreviations: COVID-19, coronavirus disease 2019; miR, microRNA; p, p value.
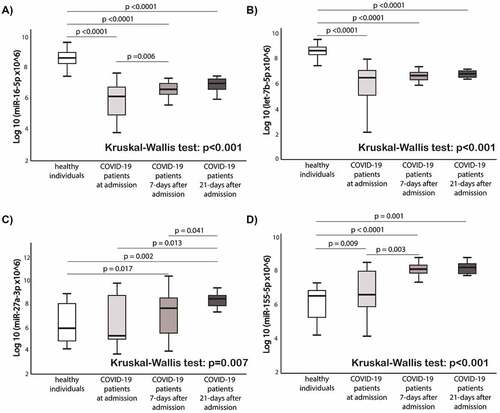
Figure 5. Baseline miR-16-5p expression box-plots and receiver operating characteristic (ROC) curves: a) miR-16-5p box-plots for hospital length of stay comparison; b) miR-16-5p ROC curve for prediction of hospital length of stay; c) miR-16-5p box-plots for hospital length of stay or death in follow-up as a composite endpoint; d) miR-16-5p ROC curve for prediction of hospital length of stay or death in follow-up as a composite endpoint. Abbreviations: AUC, Area under the ROC Curve; COVID-19, coronavirus disease 2019; miR, microRNA; N, number.
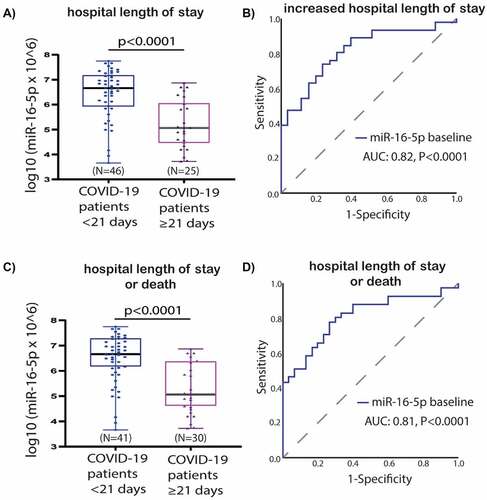
Table 4. Statistical estimates for prediction of increased hospital length of stay or death in follow-up as a composite endpoint by baseline expression of miR-16-5p.
Table 5. Multivariate logistic regression model for prediction of increased hospital length of stay or death in follow-up as a composite endpoint by low expression baseline of miR-16-5p along with clinical variables.
Supplemental Material
Download Zip (16.9 MB)Data availability statement
The data that support the findings of this study are openly available in https://www.scidb.cn/s/J3aa6f. The data entitled ‘Eyileten et al. COVID-19 miRNA’ was uploaded by Eyileten C.