Figures & data
Figure 1. Timeline of RNA research and its therapeutic applications (not to time scale). In the insert showed number of approved oligonucleotide drugs per year (1998–2022).
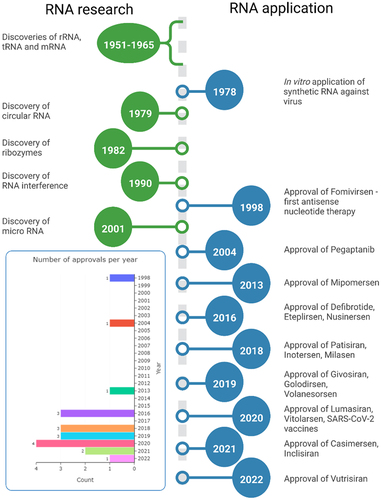
Table 1. Simplified categorization of properties of FDA approved oligonucleotide therapies.
Figure 2. Summary of features of FDA approved drugs. Bars and numbers show total counts for each feature as shown in . Each bar graph represents one of the columns.
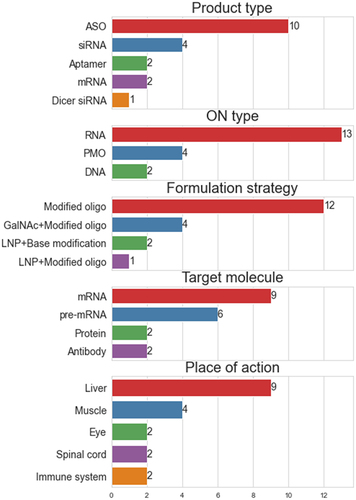
Table 2. Mechanisms of action and basic features of nucleic acid therapies.
Figure 3. Schematic representation of therapeutic RNAs with cellular entry and trafficking.
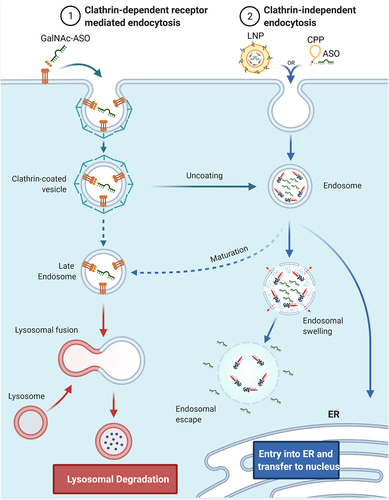
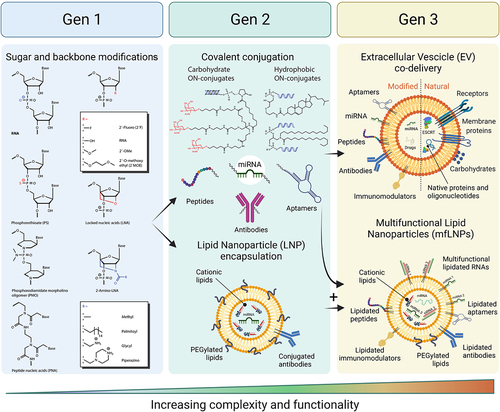
Figure 4. Categorization of RNA delivery systems into 3 generations.