
Figures & data
Figure 1. Accumulation of conserved miRNAs in M. polymorpha vegetative and reproductive organs. (A-G) sRNA NGS data (left panels) and northern blot hybridization results (right panels) from male vegetative thalli (Mv), antheridiophores (Ma), female vegetative thalli (Fv) and archegoniophores (Fa); normalized read counts are presented above each bar; RPM-reads per million; U6snRNA was used as RNA loading control; the numbers below blot images are the relative intensities of miRNA bands; control signals in each blot were treated as 1; differences in signal intensity were calculated separately for male vegetative thalli control/antheridiophores, female vegetative thalli control/archegoniophores; the left side of northern blots shows the RNA marker depicting 17–25 nucleotide long RNAs.
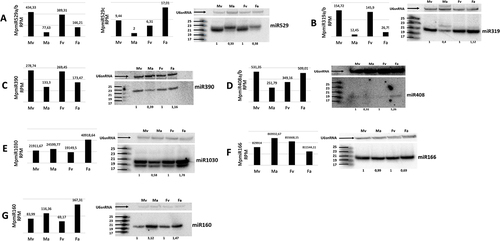
Figure 2. Accumulation profile of liverwort-specific MpmiR11737a, its pri-miRNA level, gene structure and target analyses. (A) sRNA NGS sequencing results; normalized read counts are presented above each bar; RPM-reads per million; (B) Northern blot hybridization analysis; U6snRNA was used as RNA loading control; the numbers below blot images are the relative intensities of miRNA bands; control signals in each blot were treated as 1; differences in signal intensity were calculated separately for male vegetative thalli control/antheridiophores, female vegetative thalli control/archegoniophores (numbers in the first row) or antheridiophores control/archegoniophores (numbers in the second row); the left side of northern blots shows the RNA marker depicting 17–25 nucleotide long RNAs; (C) RT-qPCR expression level of pri-MpmiR11737a; *p-value < 0.05; (D) Hairpin structure of pre-MpmiR11737a; nucleotides highlighted in gray represent MpmiR11737a sequence; the minimum free energy (∆G) of predicted structure is shown on the right side (E) MpMIR11737a gene structure (upper panel; pri-miRNA – light gray; pre-miRNA-dark gray), Mp5g12920 gene overlapping with MpMIR11737a gene (lower panel); boxes – exons (UTRs – striped; CDS – white); lines – introns; scale bar corresponds to 1kb; (F) Target plot (T-plot) of target mRNA Mp1g15010 based on degradome data; red arrow points to the mRNA cleavage site; T-plot is accompanied by a duplex of miRNA and its target mRNA; nucleotide marked in bold points to the mRNA cleavage site; (G) RT- qPCR expression level of Mp1g15010; ***p-value < 0.001; male vegetative thalli (Mv), antheridiophores (Ma), female vegetative thalli (Fv) and archegoniophores (Fa).
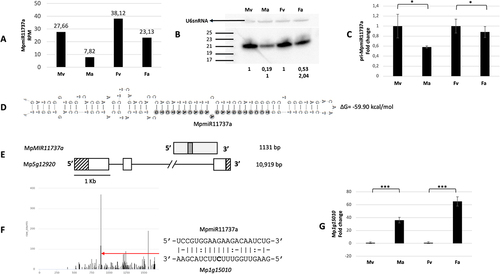
Figure 3. Accumulation profile of liverwort-specific MpmiR11737b, its pri-miRNA level and host gene structure. (A) sRNA NGS sequencing results; normalized read counts are presented above each bar; RPM-reads per million; (B) RT-qPCR expression level of pri- MpmiR11737b; *p-value < 0.05; (C) Hairpin structure of pre-MpmiR11737b; nucleotides highlighted in gray represent MpmiR11737b sequence; the minimum free energy (∆G) of predicted structure is shown on the right side (D) pre-MpmiR11737b (upper panel; dark gray), Mp8g07030 gene hosting pre-MpmiR11737b (lower panel); boxes – exons (UTRs – striped; CDS – white); lines – introns; scale bar corresponds to 1kb; male vegetative thalli (Mv), antheridiophores (Ma), female vegetative thalli (Fv) and archegoniophores (Fa).
Figure 4. Accumulation profile of liverwort-specific MpmiR11865*/MpmiR11865, its pri-miRNA level, gene structure and targets analyses. (A) Hairpin structure of pre-MpmiR11865*/MpmiR11865; nucleotides highlighted in dark gray represent MpmiR11865* sequence and in light gray MpmiR11865 sequence; the minimum free energy (∆G) of predicted structure is shown on the right side of the structure; (B) RT-qPCR expression level of pri-MpmiR11865*/MpmiR11865; *p-value < 0.05; (C) MpMIR11865 gene structure (pri-miRNA – light gray; pre-miRNA-dark gray); scale bar corresponds to 1kb; (D) MpmiR11865* sRNA NGS sequencing results (left side); normalized read counts are presented above each bar; RPM-reads per million; northern blot hybridization analysis (right side): U6snRNA was used as RNA loading control; the numbers below blot images are the relative intensities of miRNA bands; control signals in each blot were treated as 1; differences in signal intensity were calculated separately for male vegetative thalli control/antheridiophores, female vegetative thalli control/archegoniophores (numbers in the first row) or antheridiophores control/archegoniophores (numbers in the second row); the left side of northern blots shows the RNA marker depicting 17–25 nucleotide long RNAs; (E) Target plot (T-plot) of MpmiR11865* target mRNA (Mp1g05970) based on degradome data (left side); red arrow points to the mRNA cleavage site; T-plot is accompanied by a duplex of miRNA and its target mRNA; nucleotide marked in bold points to the mRNA cleavage site; RT-qPCR expression level of Mp1g05970 (right side); *p- value < 0.05; **p-value < 0.01; (F) Graph represents MpmiR11865 sRNA NGS sequencing results (left side); normalized read counts are presented above each bar; RPM-reads per million; northern blot hybridization analysis (right side): U6snRNA was used as RNA loading control; the numbers below blot images are the relative intensities of miRNA bands; control signals in each blot were treated as 1; differences in signal intensity were calculated separately for male vegetative thalli control/antheridiophores, female vegetative thalli control/archegoniophores; the left side of northern blot shows the RNA marker depicting 19–23 nucleotide long RNAs; (G) Target plot (T-plot) of MpmiR11865 target mRNA (Mp6g13460) based on degradome data (left side); red arrow points to the mRNA cleavage site; T-plot is accompanied by a duplex of miRNA and its target mRNA; nucleotide marked in bold points to the mRNA cleavage site; RT-qPCR expression level of Mp6g13460 (right side); *p-value < 0.05; antheridiophores (Ma), male vegetative thalli (Mv), archegoniophores (Fa) and female vegetative thalli (Fv).
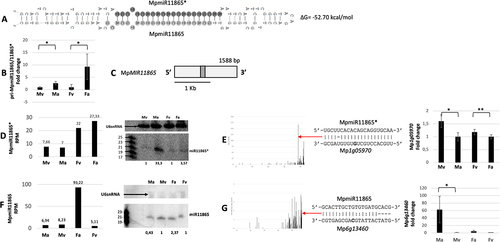
Figure 5. Accumulation profile of liverwort-specific MpmiR11887, its pri-miRNA level, gene structure and target analyses. (A) sRNA NGS sequencing results; normalized read counts are presented above each bar; RPM-reads per million; (B) Northern blot hybridization analysis; U6snRNA was used as RNA loading control; the left side of northern blots shows the RNA marker depicting 17–25 nucleotide long RNAs; (C) Hairpin structure of pre-MpmiR11887; nucleotides highlighted in gray represent MpmiR11887 sequence; the minimum free energy (∆G) of predicted structure is shown above the precursor; (D) RT-qPCR expression level of pri-MpmiR11887; *p-value < 0.05; (E) MpMIR11887 gene structure (upper panel; pri-miRNA – light gray; pre-miRNA-dark gray), putative Mp6g01830 protein-coding gene overlapping with MpMIR11887 gene (lower panel); boxes – exons (UTRs – striped; CDS – white); scale bar corresponds to 1kb; (F) Target plot (T-plot) of target mRNA Mp1g20730 based on degradome data; red arrow points to the mRNA cleavage site; T-plot is accompanied by a duplex of miRNA and its target mRNA; nucleotide marked in bold points to the mRNA cleavage site; (G) RT-qPCR expression level of Mp1g20730; *p-value < 0.05; male vegetative thalli (Mv), antheridiophores (Ma), female vegetative thalli (Fv) and archegoniophores (Fa).
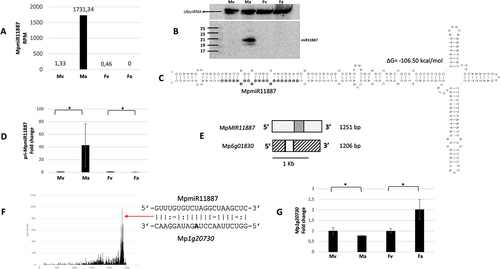
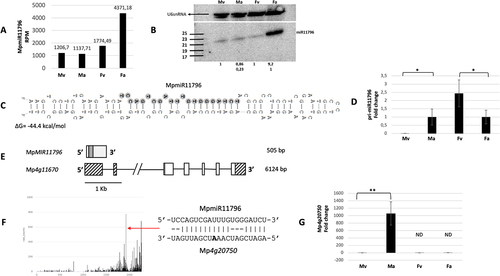
Figure 6. Accumulation profile of liverwort-specific MpmiR11796, its pri-miRNA level, gene structure and target analyses. (A) sRNA NGS sequencing results; normalized read counts are presented above each bar; RPM-reads per million; (B) Northern blot hybridization analysis; U6snRNA was used as RNA loading control; the numbers below blot images are the relative intensities of miRNA bands; control signals in each blot were treated as 1; differences in signal intensity were calculated separately for male vegetative thalli control/antheridiophores, female vegetative thalli control/archegoniophores (numbers in the first row) or antheridiophores control/archegoniophores (numbers in the second row); the left side of northern blots shows the RNA marker depicting 17–25 nucleotide long RNAs; (C) Hairpin structure of pre-MpmiR11796; nucleotides highlighted in gray represent MpmiR11796 sequence; the minimum free energy (∆G) of predicted structure is shown below the precursor; (D) RT-qPCR expression level of pri-MpmiR11796; *p-value < 0.05; (E) MpMIR11796 gene structure (upper panel; pri-miRNA – light gray; pre-miRNA-dark gray), Mp4g11670 gene overlapping with MpMIR11796 gene (lower panel); boxes – exons (UTRs – striped; CDS – white); lines – introns; scale bar corresponds to 1kb; (F) Target plot (T-plot) of target mRNA Mp4g20750 based on degradome data; red arrow points to the mRNA cleavage site; T-plot is accompanied by a duplex of miRNA and its target mRNA; nucleotide marked in bold points to the mRNA cleavage site; (G) RT- qPCR expression level of Mp4g20750; **p-value < 0.01; male vegetative thalli (Mv), antheridiophores (Ma), female vegetative thalli (Fv) and archegoniophores (Fa).
Data availability statement
The data that support the findings of this study are available in the National Center for Biotechnology Information (NCBI) Sequence Read Archive database at https://www.ncbi.nlm.nih.gov/bioproject/1008567