
Figures & data
Table 1. Non-enzymatic and enzymatic replication rates for a template of length L = 200 nt inside a protocell of radius 57 nm along with the corresponding percentage errors ().
.
,
represent non-enzymatic and enzymatic replication rates from RNA to DNA etc.
Figure 1. Pictorial representation of the reaction network inside a protocell. Red (blue) arrows indicate non-enzymatic (enzymatic) reactions. Parasites are indicated by square filled boxes whereas all other reactants and products are indicated by filled circles. Light blue filled circles denote RNA templates, peach colour filled circles denote replicases, and yellow filled circles denote DNA templates. The type of monomer used in each reaction is indicated in brackets with rNTP and dNTP indicating RNA and DNA nucleotides respectively. The left panel shows the reactions possible initially in presence of RNA templates only. The middle panel shows the non-enzymatic reactions possible after the emergence of DNA templates. Ch-1, Ch-2 and Ch-3 denote three different channels for non-enzymatic replication of the three different types of DNA templates. The right panel (blue arrows) shows the enzymatic reactions possible upon emergence of a replicase ribozyme. The numbers 1–9 correspond to the reaction numbers specified in the main text. Arrows with multiple arrowheads denote the possible products of a reaction.
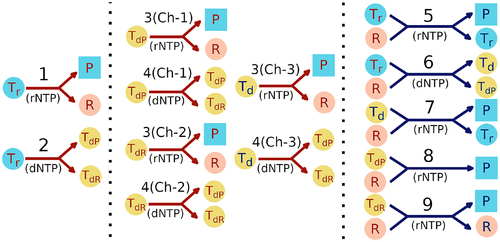
Figure 2. Schematic representation of three different modes of protocellular competition: ,
corresponds to the
and
protocell.
denotes the total number of strands inside the
protocell,
is the upper limit of
and
is the fitness of the protocell. Vesicles: if
exceeds the upper limit
, while
,
will divide into two daughter vesicles and
is eliminated. Water-in-oil droplets:
and
are equally likely to eliminate each other through a random selection process. The surviving droplet divides into two daughter droplets. Coacervate droplets: if
contains larger number (or fraction) of ribozymes (
) compared to
;
and
is more likely to eliminate
and divide into two daughter protocells.
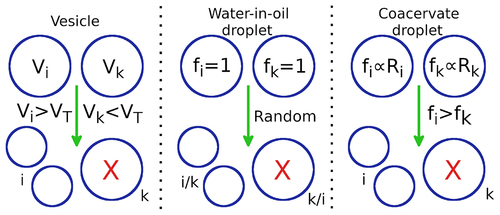
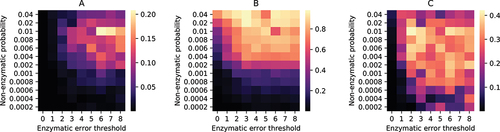
Figure 3. Stochastic simulation of a population of water-in-oil droplets containing strands. Heatmaps for A: average fraction of replicase ribozymes per droplet; B: fraction of droplets containing both replicase () and replicase encoding DNA template (
); C: average reaction propensity of reaction 9 per droplet; with different non-enzymatic ribozyme creation probabilities and error thresholds of enzymatic replications. The heatmaps are generated by taking both ensemble average and time average of the quantities at equilibrium.
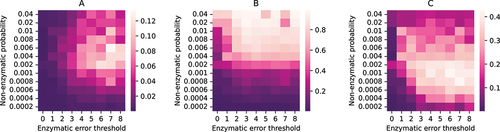
Figure 4. Stochastic simulation of a population of water-in-oil droplets (). Time evolution of the A: Average number of different types of strands per droplet; B: Percentage of droplets containing different types of strands; C: Average reaction propensities of the nine types of reactions per droplet. Panels A and B have the same legends.
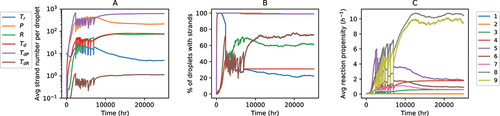
Figure 5. Stochastic simulation of a population of coacervate droplets containing strands. Heatmaps for A: average fraction of replicase ribozymes per droplet; B: fraction of droplets containing both replicase () and replicase encoding DNA template (
); C: average reaction propensity of reaction 9 per droplet; with different non-enzymatic ribozyme creation probabilities and error thresholds of enzymatic replications. The heatmaps are generated by taking both ensemble average and time average of the quantities at equilibrium.
Supplementary_RNA_Biology.pdf
Download PDF (1.2 MB)Data availability statement
All codes used to generate the results in the manuscript and in the electronic supplementary material are available at this https://github.com/suvamroy/Codes/tree/master/RNA_DNA_WorldGithub link.