
Figures & data
Figure 1. KmPlots survival graphs of breast cancer patients (80 months) with the presence or absence of ER, PR, and HER2 receptors in relation to LINC00052 expression. A) ER+ patient sample group (n = 1475); B) Luminal a ER+ patient sample group (n = 1480); C) PR+ patient sample group (n = 2315); D) TNBC patient sample group (ER-, PR-, HER2-) (n = 126). p < 0.05.
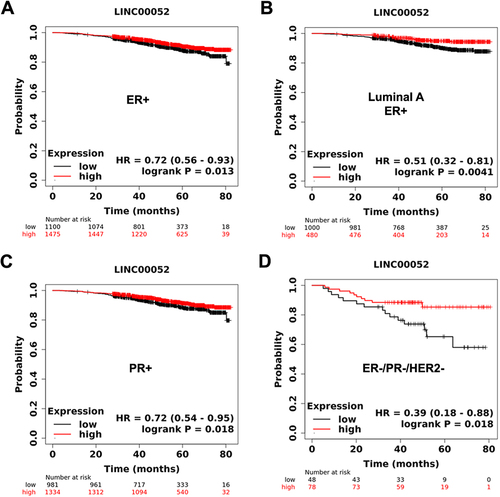
Figure 2. Expression values and changes of LINC00052 in PAM50 breast cancer subtypes. A) Amount of LINC00052 FPKMs expressed in log2, with significant differences shown on the right side for various subtypes of breast cancer (p < 0.05) from the TCGA database project. B) Expression of LINC00052 transcript according metabric database. C) LINC00052 expression levels in an in-cohort house of BC Mexican patients samples was assessed by RT-qPCR. Statistical comparisons between the groups and their p-values are shown.
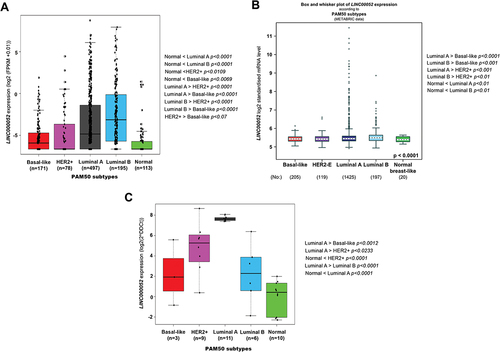
Figure 3. Expression levels of LINC00052 in relation to hormone receptors. A) Expression levels of LINC00052 in log2 FPKMs in HER2+/- samples on a logarithmic scale. B) Expression levels of LINC00052 in log2 FPKMs in ER+/- and PR+/- samples. Statistical significant p-values are: ER+/PR+ > ER-/PR- < 0.0001, ER+/PR-> ER-/PR- < 0.01 and ER+/PR+ > ER-/PR+ < 0.01. C) Boxplot of ESR1 expression in log2 FPKMs in 1104 breast cancer samples (cancer) adjacent normal tissue samples (Normal). D) Boxplot of ESR2 expression in log2 FPKMs in 1104 breast cancer samples (Cancer) and 113 adjacent normal tissue samples (Normal). E) Graph of pS2 expression in estradiol-stimulated and unstimulated BC cell lines (10 nM) on the y-axis showing expression levels (Fold change). F) Graph of LINC00052 expression in estradiol-stimulated and unstimulated BC cell lines (10 nM) on the y-axis showing expression levels (Fold change). Results from three to six independent experiments are shown, p-values = * 0.01, ** 0.001 and *** 0.0001.
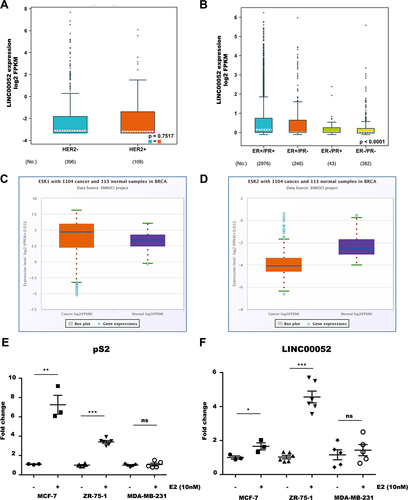
Figure 4. Heatmaps of LINC00052 FC and enrichments of pathways and processes in different molecular subtypes of breast cancer. A) Comparison of log2 FC of LINC00052 among molecular subtypes of breast cancer. B) Score (change value) of cell cycle enrichment. C) Graph shows the average of G1, S, and G2/M cell cycle phases with standard deviation (SD) with and without MMC treatment (24 h) in MCF7 cells, both in control and with LINC00052 levels inhibited with two shRnas. D and E) Graphs show shLuc, shA, and shB cell lines viability (absorbance 580 nm) upon growth in a 1% FBS (D) condition or 10% FBS (E) during indicated time points (1, 2, 4, 6, and 8 days). Results from three to independent experiments are shown, p-values = * 0.01, ** 0.001, *** 0.0001 and **** 0.00001.
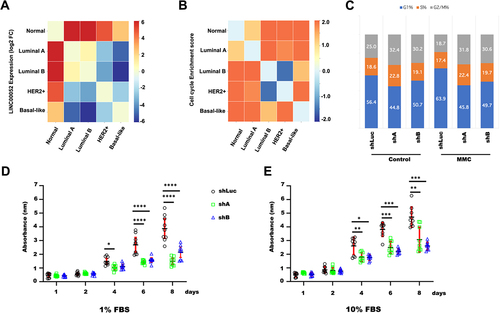
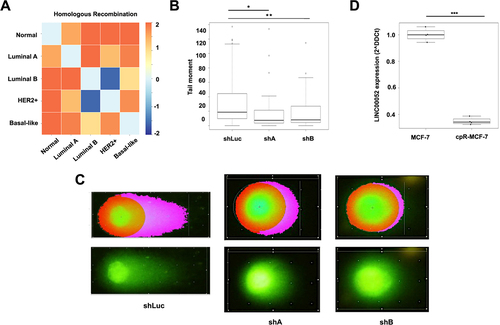
Figure 5. A) Heatmap of homologous recombination process enrichment score. B)Box plot showing the quantification of comet tail moment in COMET assays. C) Pictures represent cells in the comet assays, on the left side observed with komet analysis software, while on the right side, images represent cells directly under an epifluorescence microscope at 40X magnification. Results from three independent experiments are shown: shLuc vs. shA: p-values = * 0.0000165 and shLuc vs. shB: ** 0.003. D) Graph shows LINC00052 expression (2^-DDCt) in MCF-7 and cpR-MCF-7 cells, p-value = *** 0.0001.
Supplemental Material
Download Zip (1.6 MB)Data availability statement
Data will be made available on request.