
Figures & data
Figure 1. The workflow of circRNAs enrichment and sequencing. Total RNA was extracted from three biological replicate sample of cattle liver and rumen tissue. circRNA enriched libraries were constructed using the methods: Ribo: rRNA depletion using Ribo-zero (Green line); R: RNase R (Brown line); RTP: RNase R + Tailing + Poly (A) depletion (Blue line); Ribo-R: Ribo-zero + RNase R (Yellow line); Ribo-RP: Ribo-zero + RNase R + Poly (A) depletion (Red line); Ribo-RTP: Ribo-zero + RNase R + Tailing + Poly (A) depletion (Purple line). The libraries were sequenced using Novaseq 6000 S4 PE100 platform (Illumina). After quality control and alignment, remaining reads were used for circRNAs identification. BSJ: Back-splicing junction.
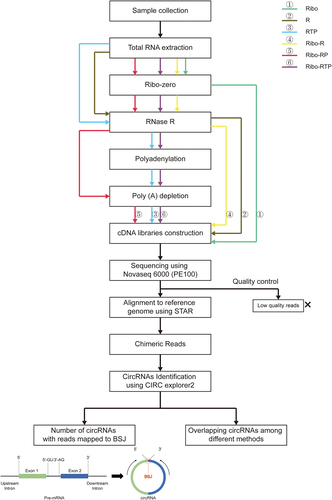
Figure 2. The ratio of uniquely mapped reads (a proportion of the reads uniquely mapped to the reference genome out of all clean reads) from different circRNA enrichment methods. The Chi-Square value and the adjusted p value (Asymptotic Sig) of the Kruskal-Wallis H test are shown. Ribo: rRNA depletion using Ribo-zero (Green box); R: RNase R (Brown box); RTP: RNase R + Tailing + Poly (A) depletion (Blue box); Ribo-R: Ribo-zero + RNase R (Yellow box); Ribo-RP: Ribo-zero + RNase R + Poly (A) depletion (Red box); Ribo-RTP: Ribo-zero + RNase R + Tailing + Poly (A) depletion (Purple box).
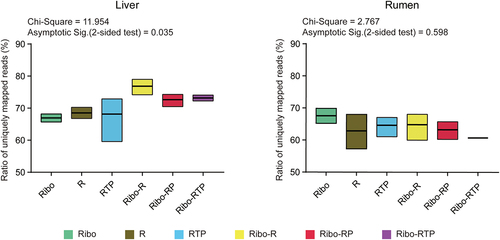
Table 1. Summary of sequencing data and the number of identified circRnas.
Figure 3. The quality and number of identified circRNA. The false-positive rate and the number of circRNA per million clean reads were calculated for liver (A) and rumen (B), respectively. The Chi-Square value and adjusted p value (Asymptotic Sig) of the Kruskal-Wallis H test are shown. The value on the left is for false-positive rate and the value on the right is for the number of circRNA per million clean reads. Different lowercase letters indicate significant differences for pairwise comparison of false-positive rate (Adjusted p < 0.05), and uppercase letters indicate significant differences for pairwise comparison of the number of circRNA per million clean reads (Adjusted p < 0.05). Ribo: rRNA depletion using Ribo-zero (Green); R: RNase R (Brown); RTP: RNase R + Tailing + Poly (A) depletion (Blue); Ribo-R: Ribo-zero + RNase R (Yellow); Ribo-RP: Ribo-zero + RNase R + Poly (A) depletion (Red); Ribo-RTP: Ribo-zero + RNase R + Tailing + Poly (A) depletion (Purple).
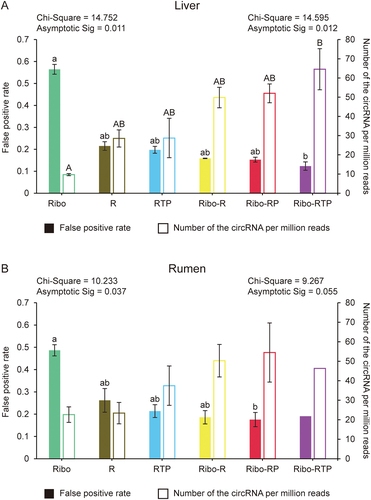
Figure 4. Identified circRNAs intersection between different methods. The upset plots of the liver (a) and rumen (b) were generated based on the circRnas with at least two reads mapped to the back-splicing junction (BSJ) position and identified in all biological replicates within the group. The longitudinal axis represents the intersection size of the circRNA number. The horizontal axis represents the input circRNA number of each group. The dark circles indicate sets that are part of the intersection. The clustered bar on the left bottom presented the total number of exonic circRnas (filled) and intronic circRnas (frame) identified by different method. Ribo: rRNA depletion using Ribo-zero (Green); R: RNase R (Brown); RTP: RNase R + Tailing + Poly (A) depletion (Blue); Ribo-R: Ribo-zero + RNase R (Yellow); Ribo-RP: Ribo-zero + RNase R + Poly (A) depletion (Red); Ribo-RTP: Ribo-zero + RNase R + Tailing + Poly (A) depletion (Purple).
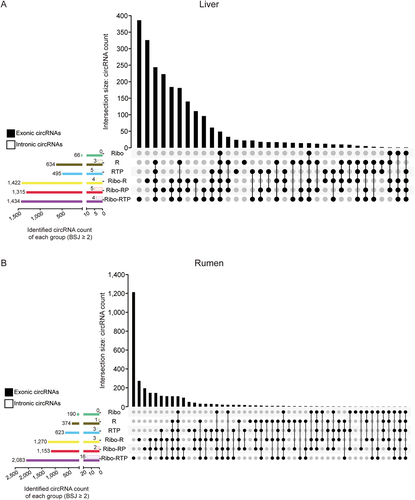
Figure 5. CircRNA conservation between cattle and human. (a) The workflow used to identify circRNAs conserved between cattle and human. Cattle circRNAs were divided into six types (marked with roman number) and schematic diagrams of conserved circRNAs were represented (Blue: human circRNAs, Red: cattle circRNAs). (b) The proportion of different types of cattle circRNAs when compared with human circRNAs. (c) The density of conserved circRNAs on cattle chromosomes. The number of circRNAs was corrected with chromosome length (Mb).
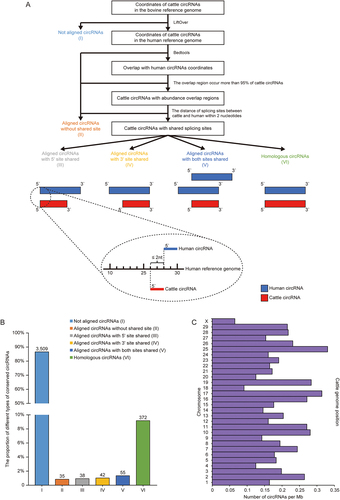
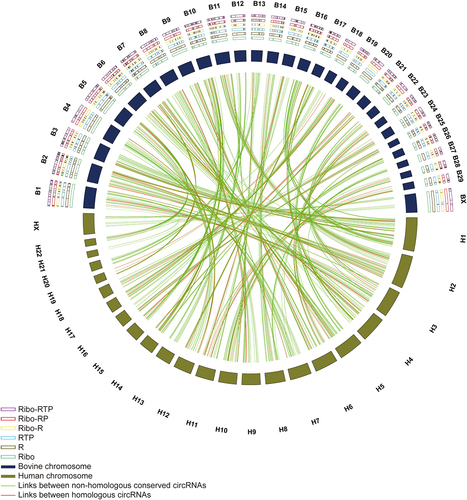
Figure 6. Circos plot of circRNAs conserved between bovine and human genome. The outermost layer is the chromosome name (Bovine: B1 - BX; Human: H1 – HX). The conserved circRNAs identified in different enrichment methods were labelled as black lines in the frame (Ribo-RTP, purple frame; Ribo-RP, red frame; Ribo-R, yellow frame; RTP, blue frame; R, brown frame; Ribo, green frame). The relative length of cattle and human chromosomes were represented by deep purple and deep brown boxes, respectively. The conserved cattle circRNAs and corresponding human circRNAs are linked using lines. Green lines represent links between non-homologous conserved circRNAs, and red lines represent homologous circRNAs.
Supplemental_Table_3_revised.pdf
Download PDF (83.8 KB)Figure_S2.tif
Download TIFF Image (750.8 KB)Supplemental_Table_2.pdf
Download PDF (3.1 MB)Figure_S1.tif
Download TIFF Image (2 MB)Supplemental_Table_1.pdf
Download PDF (14.4 MB)Data availability statement
The five sequencing datasets of Ribo method were downloaded from Sun et al. projects (GEO accession number GSE116775) [Citation43]. All the sequencing datasets generated from current study have been deposited at the National Center for Biotechnology Information (NCBI) Gene Expression Omnibus (GEO) database (https://www.ncbi.nlm.nih.gov/geo/) under accession number GSE226717.