
Figures & data
Figure 1. Subtle temperature dependent mRNA degradation decreases the number of functional transcripts.
A) mRNA encoding firefly luciferase (fluc) of about 2 kb long was incubated at either 70°C or 95°C for 0–30 min and subsequently evaluated using CGE (200 ng per lane). The electropherogram depicts the mRNA samples that were incubated at 70°C with more detailed views on the pre-peak shoulder and peak migration (insets). Regional boundaries were manually placed at the ‘+’ signs to delineate the smear region from the peak region. The smear analysis for these regions is depicted in the bar graph on the right (3 technical replicates). Additional electropherograms can be found in Figure S1. b) Fluc mRNA (500 ng) was incubated in nuclease free (NF)-water at the indicated temperatures for either 5 or 10 min. These samples were then used in a rabbit reticulocyte lysate (RRL) assay which was continuously measured on a luminometer in the presence of substrate D-luciferin (3 technical replicates). Both the continuous measurements and the derived AUC values indicate that a decrease in the number of functional transcripts is already noticeable after incubating mRNA for 5 min at room temperature (23°C) and that incubating mRNA for 10 min at 70°C substantially decreases expression even further. c) For each indicated timepoint, fluc encoding mRNA (500 ng) was heated at either 70°C (3 independent experiments, error bars depict SD) or 95°C (n = 1) in PBS and subsequently used in a 1-h RRL assay and a luminescence readout of the produced fluc proteins.
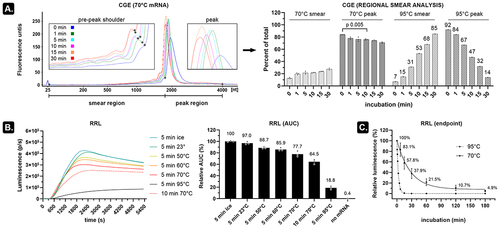
Figure 2. PNPase and oligo-T30 can be combined to selectively release measurable ADP from mRNA fragments.
A) mRNA encoding fluc was digested for 1 h by Exo T and mixed with undigested (intact) mRNA at the indicated fractions. We detected a differential luminescence signal in mRNA mixed with as low as 0.1% digested mRNA (paired t-test p 0.001) upon incubating these samples with the Lucipac A3 reagents (the dots represent technical replicates). b) When using PNPase, the signal from the heat degraded mRNA only starts to drop when mRNA was degraded for more than 15 min. In contrast, in the presence of 500-fold molar excess T30, excessive signal generated at the poly(A) tail is suppressed. The average signal derived from mRNA in the presence of T30 increases relatively to the signal obtained in the absence of T30 (depicted in the right graph as T30+/T30- ratio). When loaded on agarose GE, the heat degraded mRNA fragments also demonstrate a concurrent decrease in size. c) Annealing 500-fold molar excess T30 to intact mRNA quenches PNPase-mediated luminescence. The background luminescence is mainly associated with the PNPase homotrimer itself (n ≥ 6). d) One-hour PNPase digestion shortens both modified (5moU) and unmodified (U) mRNA. Addition of T30 oligos but not random oligos (R1, R2 and R3) prevents this shortening, as indicated by agarose GE (DNA ladder is indicated with ‘L’). e) Addition of T30 to the PNPase digestion reaction exhibits a concentration-dependent suppression of luminescence from intact mRNA with saturation reached at 1000-fold molar excess. f) Representation of the enzymatic RNA degradation assay: an exoribonuclease is blocked by T30 oligos at the poly(A) tail of intact mRNA (blue) but can digest truncated or damaged mRNA fragments (red). This liberates AMP or ADP which can subsequently be converted to ATP and measurable light.
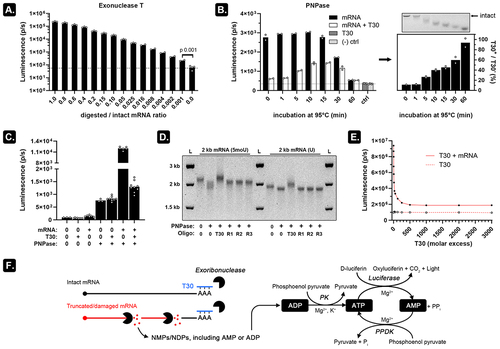
Figure 3. An optimized PNPase assay is fast, sensitive, and does not depend on the size of the mRNA analyte.
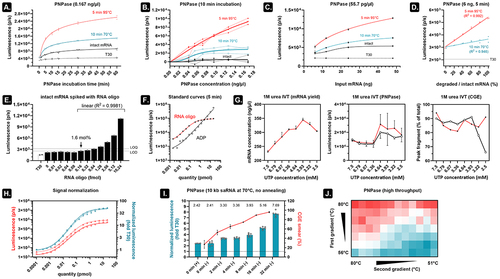
A) 12 ng heat degraded mRNA (2 kb) was subjected to the PNPase assay (1000-fold T30, 0.167 ng/µl PNPase) over the indicated time period. Most of the signal is generated within 15 min of incubation. b) 6 ng of heat degraded 2 kb mRNA was evaluated in the PNPase assay (10 min digestion) using varying concentrations of PNPase (x-axis) in 3 independent experiments performed on different days. The increasing background luminescence associated with the PNPase was subtracted from all depicted values. c) Using a final concentration of 55.7 pg/µl PNPase, higher input mRNA increases the signal difference between intact and heat degraded mRNA. Three technical replicates and error bars represent SD. d) Even at 6 ng input mRNA and only 5 min of incubation, a linear increase in luminescence is seen when gradually more degraded mRNA is present. e) 10 fmoles 2 kb mRNA was spiked with increasing quantities of a 60-mer RNA oligo and evaluated in the PNPase assay (10 pmol T30, 55.7 pg/µl PNPase, 10 min digestion). The LOD (3.3*SD) and LOQ (10*SD) are estimated by aggregating the measurements below 0.16 fmol RNA oligo. Luminescence values from 0.16 fmol to 10.24 fmole demonstrate excellent linearity. f) A standard curve of the 60-mer RNA oligo and ADP was made in absence of mRNA (but in the presence of T30). In the linear range of both graphs (10-100 fmole), 4-5 ADPs per RNA oligo are released. g) Twenty-four 1 M urea supplemented IVT reactions were performed using 8 different UTP concentrations (3 replicates). After incubating with DNase, the resulting mRNA was purified using silica beads and then subjected to UV spectrophotometry and PNPase assays (two independent repeats performed on different days, error bars depict SEM). The CGE analysis was also performed on two different days, but the three replicates were combined to form each sample. h) Dividing the luminescence signal of two independently repeated standard curves of a 60-mer RNA oligo (left y-axis) by their respective T30-only controls (right y-axis) minimizes variability. i) Cellulose-purified 10 kb saRNA was heat degraded at 70°C for the indicated time periods and analysed on non-denaturing CGE (right Y-axis, two technical repeats, 200 ng per lane, error bars depict SD). When omitting the annealing time and evaluating the heat degraded saRNA in the PNPase assay (5 min digestion, performed in six independent replicates on multiple days), we can detect saRNA fragments with similar sensitivity as CGE and minimal variability (left Y-axis; values are noted above each bar; (+) indicates 10 min annealing at room temperature, whereas (-) indicates where the annealing step was omitted). j) Ten femtomoles of Cre recombinase mRNA (~1 kb, Trilink) was distributed in a 96 well plate and first subjected to a 5-min heat gradient (80-56°C) along the vertical direction in a thermocycler. We then applied a 5-min heat gradient (80-51°C) along the horizontal direction. The heat map represents T30-normalized values from a PNPase assay (1000-fold molar excess T30, no annealing step, 5 min PNPase digestion).
Supplemental material
Combes2024_PNPaseAssay_supplement.docx
Download MS Word (270.1 KB)Figure Supplement.tif
Download TIFF Image (374 KB)Data availability statement
The authors confirm that the data supporting the findings of this study are available within the article and its supplementary materials.