
Figures & data
Figure 1. Our combination KOs of key rRNA modification enzymes for E. coli. The secondary structure contains most of domain V of the 23S rRNA, including the ‘critical region’ (hollow box) around the PTC loop. Shown are all domain V modifications (ho5C is partial) and the modification enzyme KOs used in this study (filled boxes). Base pairing with aminoacyl-tRNA at the A site is shown. Modified from Liljeruhm et al. (2022) with permission.
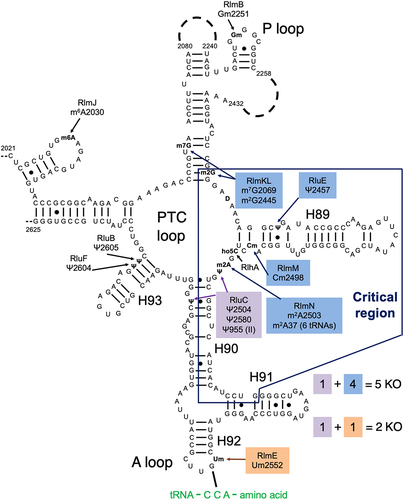
Figure 2. In vitro fast kinetics-based elongation assays of KO ribosomes. fMet-Phe (fMF) dipeptide formation rates at 20°C (A) and 37°C (B), and fMet-Phe-Phe (fMFF) tripeptide formation rates at 20°C (C) and 37°C (D). (E) Calculated translocation rates at 37°C with different EF-G concentrations. Error bars are standard errors, n ≥ 2. p values are not shown for non-significant comparisons. Left three bars in Fig. 2D taken from Liljeruhm et al. (2022).
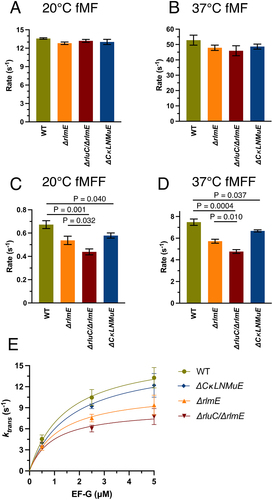
Figure 3. In vitro fast kinetics-based release assays of KO ribosomes. (A) Drawing of release assay depicting RF1-catalyzed hydrolysis (blue star) of the fMet acyl linkage on the initiator tRNA. Rates at 20°C (B) and 37°C (C). Error bars are standard errors, n ≥ 2. Calculated p values > 0.05 based on one-tailed t-test.
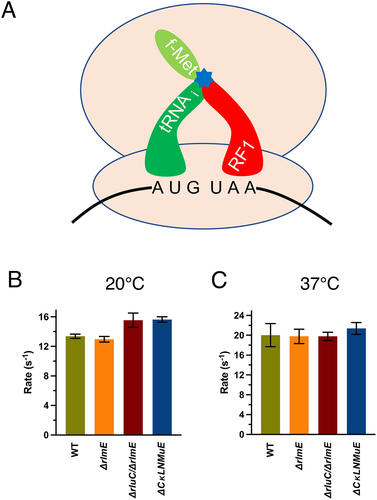
Figure 4. Ribosome sucrose gradient profiles and in vitro reconstitution assays with ΔCKLNMuE. (A) Representative ribosome sucrose gradient profiles at 5 mM Mg2+ of ΔCKLNMuE and WT ribosomes. (B) Drawing of extractions of total 50S rRNAs and total 50S proteins and their reconstitutions. (C) Fragment reactions at 37°C of respective reconstitutions drawn directly above. TP50: total 50S proteins. Error bars are standard errors, n = 4.
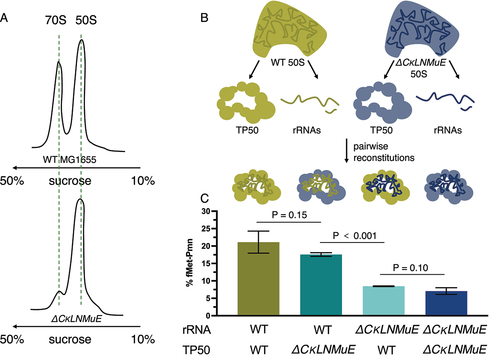
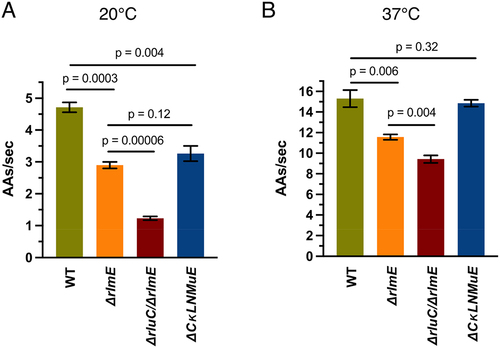
Figure 5. Influence of rRNA modification enzyme KOs on in vivo elongation rates measured by β-galactosidase induction at 20°C (A) and 37°C (B). Error bars are standard errors, n = 3.
20240604 revised Sup.docx
Download MS Word (3.2 MB)Data availability statement
The data supporting the study are presented in the figures and tables in the main text and the supplementary material and are available in more detail upon request from LB and AF.