Figures & data
Figure 1. Size distribution and particle concentration. Measurements obtained using NTA. (A) GNP. (B) SNP. Graph presented is representative of four independent experiments. x-axis: diameter (nm); y-axis: particle number (×106/ml).
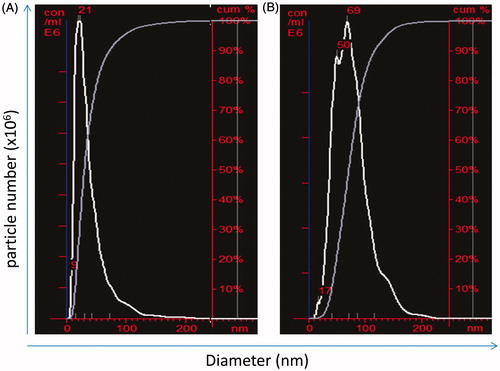
Table 1. Distribution of size and number determined by NTA.
Figure 2. Effects of NP on mouse splenic lymphocyte and human PBL viability. (A) GNP. (B) SNP. Data shown are means (±SEM) of three experiments. *p < .05, NP treated versus control.
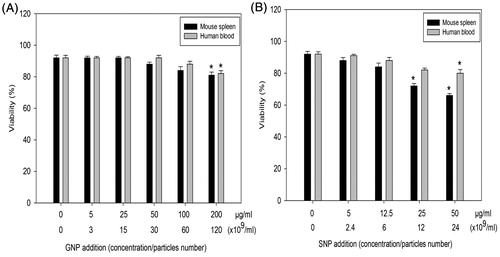
Figure 3. Effects of NP on unstimulated murine splenic lymphocytes and human PBL [3H]-thymidine incorporation. (A) GNP. (B) SNP. Data shown are means (±SEM) of three experiments. *p < .05, NP treated versus control.
![Figure 3. Effects of NP on unstimulated murine splenic lymphocytes and human PBL [3H]-thymidine incorporation. (A) GNP. (B) SNP. Data shown are means (±SEM) of three experiments. *p < .05, NP treated versus control.](/cms/asset/55cd293d-74d3-4d58-9d91-1b607e348908/iimt_a_1234522_f0003_b.jpg)
Figure 4. Effects of NP on mitogen-stimulated lymphocyte proliferative response of murine splenic lymphocytes. (A) GNP. (B) SNP. Mean stimulation indices with mitogens: LPS =23 (±1), ConA =25 (±1) are normalized to 100% value. Data shown are means (±SEM) of three experiments. *p < .05, NP treated versus control.
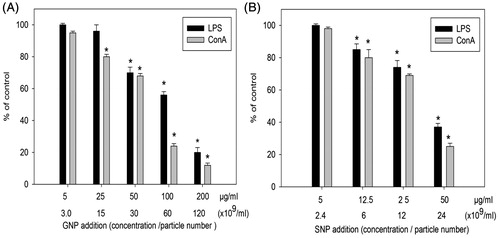
Figure 5. Effects of NP on mitogen-stimulated proliferative response of human PBL. (A) GNP. (B) SNP. Mean stimulation indices with mitogens: PHA =58 (±2) and PWM =24 (±1) are normalized to 100% value. Data shown are means (±SEM) of three experiments. *p < .05, NP treated versus control.
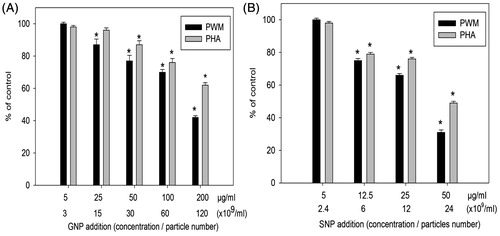
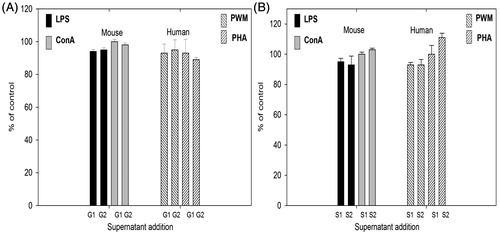
Figure 6. Mitogen-stimulated proliferative responses of lymphocytes cultured in NP-free supernatants obtained from GNP and SNP incubated in complete medium for 72 h. (A) GNP G1 = 50 μg/ml, G2 = 200 μg/ml. (B) SNP: S1 = 12.5 μg/ml, S2 = 50 μg/ml. Mean stimulation indices with mitogens: LPS =22 (±1), ConA =17 (±2), PHA =21 (±1) and PWM =54 (±3) are normalized to 100% value. Data shown are means (±SEM) of three experiments.