
Figures & data
Figure 1. Exposure to triclosan induced toxicity and altered expression of barrier genes in EpiDerm tissues. (A) Fold-change in optical density (OD) (450 nm) compared to vehicle control in culture media to detect LDH release following 6, 24, and 48 h of 0% triclosan (acetone vehicle) or 0.05–0.2% triclosan. Bars represent mean (± SEM) of two samples/group. *p < 0.05 vs. 0% triclosan. Fold-change in gene expression compared to vehicle control of (B) FLG, (C) FLG2, (D) KRT10, (E) KRT14, (F) TJP1, and (G) OCLN following 6, 24, and 48 hr of 0% triclosan (vehicle) or 0.05–0.2% triclosan. Bars represent mean (± SEM) of two samples/group. *p < 0.05 vs. 0% triclosan.
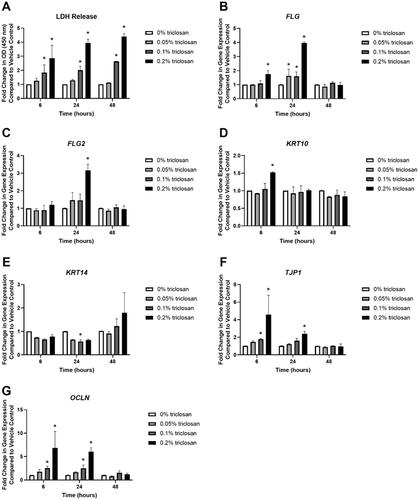
Figure 2. Exposure to triclosan on EpiDerm tissues altered the gene expression of cytokines. Fold-change in gene expression compared to vehicle control of (A) TSLP, (B) IL1A, (C) IL1B, (D) TNF, (E) CXCL1, (F) CXCL2, (G) CXCL8, and (H) S100A8 following 6, 24, and 48 h of 0% triclosan (acetone vehicle) or 0.05–0.2% triclosan. Bars represent mean (± SEM) of two samples/group. *p < 0.05 vs. 0% triclosan.
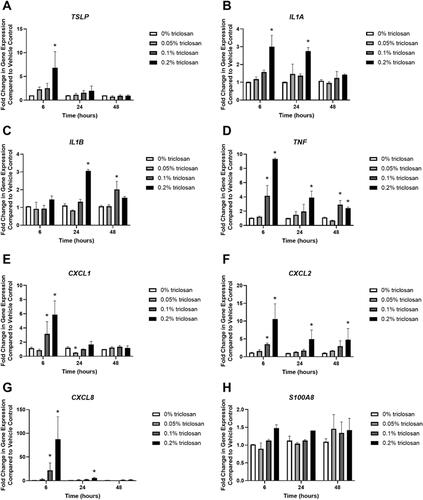
Table 1. Cytokines and growth factors (pg/ml) released following 24 and 48 h of triclosan exposure on EpiDerm.
Figure 3. Exposure to triclosan on EpiDerm tissues altered barrier permeability. (A) Fold-change in fluorescence intensity compared to vehicle control following 24 and 48 h of 0% triclosan (vehicle) or 0.1–0.2% triclosan. Bars represent mean (± SEM) of two samples/group. *p < 0.05 vs. 0% triclosan. (B) Epidermal thickness (µm) following 24 and 48 hr of 0% triclosan (acetone vehicle) or 0.2% triclosan. Bars represent mean (± SEM) of two samples/group. *p < 0.05 vs. 0% triclosan. Representative hematoxylin and eosin images of EpiDerm tissues following 24 h of exposure to acetone vehicle (C) or 0.2% triclosan (D) and 48 h of exposure to acetone vehicle (E) or 0.2% triclosan (F). Scale bar = 20 µm.
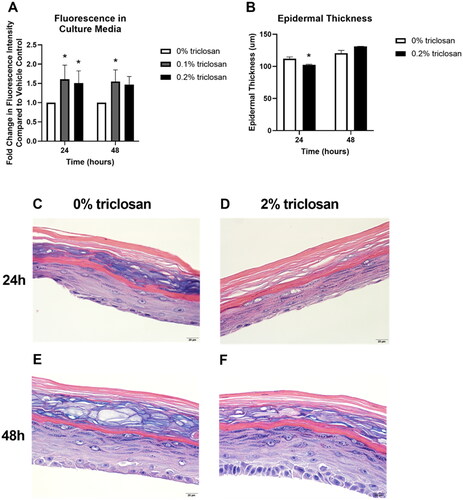
Figure 4. Repeated exposure to triclosan increased toxicity in EpiDerm tissues. (A) Fold-change in optical density (OD) (450 nm) compared to vehicle control in culture media to detect LDH release following 5 days of 0% triclosan (acetone vehicle) or 0.1–0.2% triclosan. Bars represent mean (± SEM) of two samples/group. *p < 0.05 vs. 0% triclosan. Fold-change in gene expression compared to vehicle control of (B) FLG, (C) FLG2, (D) KRT10, (E) KRT14, (F) TJP1, and (G) OCLN following 5 days of 0% triclosan (acetone vehicle) or 0.1–0.2% triclosan. Bars represent mean (± SEM) of two samples/group.
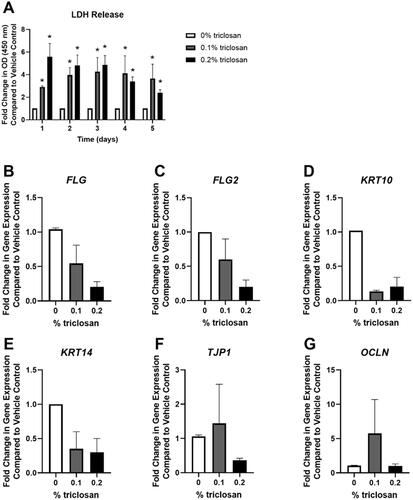
Figure 5. Repeated exposure to triclosan on EpiDerm tissues changed expression of immune-related genes. Fold-change in gene expression compared to vehicle control of (A) TSLP, (B) TNF, (C) CXCL2, (D) CXCL8, and (E) S100A8 following 5 days of 0% triclosan (acetone vehicle) or 0.1–0.2% triclosan. Bars represent mean (± SEM) of two samples/group. *p < 0.05 vs. 0% triclosan.
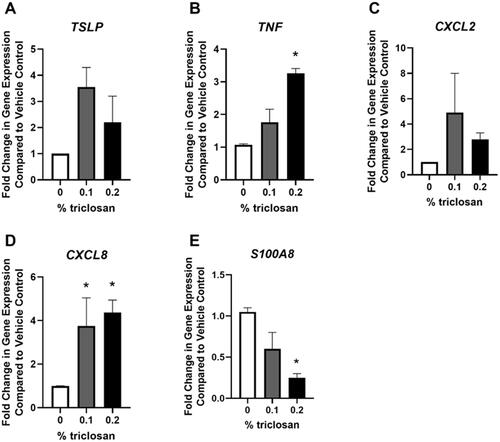
Figure 6. Repeated exposure to triclosan on EpiDerm tissues had no significant impact on permeability. Fold-change in fluorescence intensity compared to vehicle control following 5 days of 0% triclosan (acetone vehicle) or 0.1–0.2% triclosan. Bars represent mean (± SEM) of two samples/group.
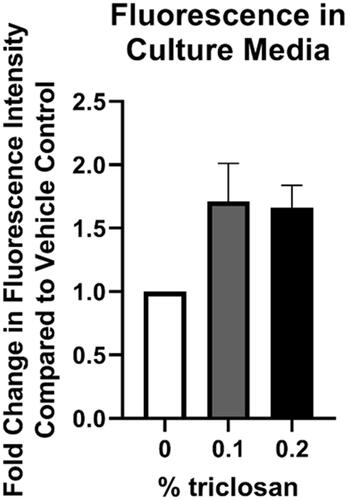
Table 2. Cytokines and growth factors (pg/ml) released following 5 days of triclosan exposure on EpiDerm.