Figures & data
Figure 1. Mice deficient in lung epithelial MyD88 exhibit decreased influx of total cells and neutrophils following a single ODE exposure, without modulation in pro-inflammatory cytokines/chemokines. Control (SPCCre−/− MyD88fl/fl) and mutant (SPCCre± MyD88fl/fl) mice were treated once with ODE or saline; bronchoalveolar lavage fluid (BALF) was collected 5 h following the exposure. Bars depict mean ± SEM of (A) total cells, neutrophils, macrophages, and lymphocytes enumerated and (B) levels of TNFα, IL-6, and neutrophil chemoattractants CXCL1 and CXCL2. There are no differences in cytokines/chemokines between ODE-treated Cre+ vs. Cre− mice. N = 5 mice/group (saline), N = 7 (control-ODE), N = 8 (Mutant-ODE) from at least two independent experimental runs. Statistical differences vs. saline-treated mice are depicted as *p < 0.05; ***p < 0.001 and between groups as #p < 0.05; ###p < 0.001 by ANOVA.
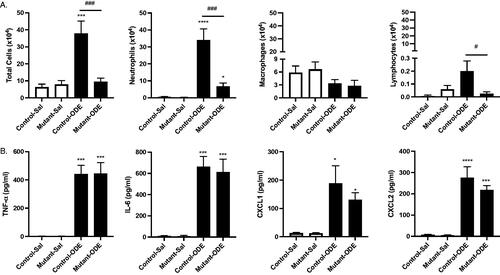
Figure 2. Mice deficient in lung epithelial MyD88 exhibit decreased influx of total cells, neutrophils, macrophages, and TNFα release after repetitive 1-week but not 3-week exposures. Control (SPCCre−/− MyD88fl/fl) and mutant (SPCCre± MyD88fl/fl) mice were treated daily with ODE for 1 or 3 weeks, whereupon bronchoalveolar lavage fluid (BALF) was collected 5 h after the final exposure. Saline control is pooled samples of control- and mutant-saline mice for reference. Bar graphs depict mean ± SEM of total cells, neutrophils, macrophages, and lymphocytes and levels of TNFα, IL-6, and neutrophil chemoattractants CXCL1 and CXCL2 in the lungs of (A) 1-week and (B) 3 weeks treated mice. N = 10 mice/group (saline), N = 7 (control and mutant, 1 week), N = 7 (control, 3 weeks), and N = 8 (mutant, 3 weeks) from at least two independent experimental runs. Statistical differences vs. saline treated mice are depicted as *p < 0.05, **p < 0.01, ***p < 0.001, and between groups as ##p < 0.01 by (A) ANOVA and (B) Mann–Whitney.
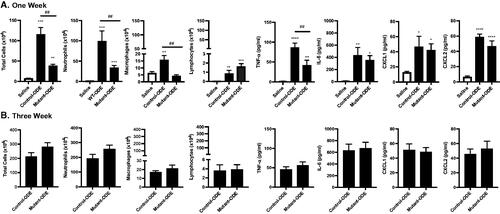
Figure 3. Mice deficient in lung epithelial MyD88 exhibit decreased lung neutrophil infiltrates following 1 week of repetitive ODE exposure. Control (SPCCre−/− MyD88fl/fl) and mutant (SPCCre± MyD88fl/fl) mice were treated daily with ODE for 1 week before lung tissue was processed by flow cytometry and histopathology. Bar graphs depict mean ± SEM of (A) total lung cells enumerated by hematocytometer; (B) Ly6G+ neutrophils determined as percentage of CD45+ lung cells by flow cytometry analysis, and (C) this percentage multiplied by total cells to determine total lung neutrophils count. A representative H&E-stained lung section from each group is shown. N = 7 (control and mutant, 1 week) from two independent experimental runs. Scale = 100 μm. Statistical differences determined by Mann–Whitney.
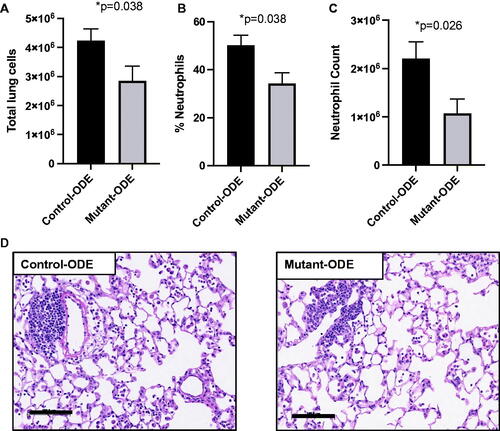
Figure 4. ODE-induced inflammatory mucin levels of Muc5ac were significantly reduced in mice deficient in lung epithelial MyD88. (A) Lung sections from repetitive (1 week) ODE treated control (SPCCre−/− MyD88fl/fl) and mutant (SPCCre± MyD88fl/fl) mice were stained for mucins (red) with lectin UEA-1 for Muc5ac and mouse anti-Muc5b with nuclei staining (DAPI, blue). (B) Airway-associated intracellular mucin was quantified (ImageJ); bars mean ± SEM of volume densities between treatment groups (N = 3 control, N = 5 mutant). Statistical differences determined by Mann–Whitney.
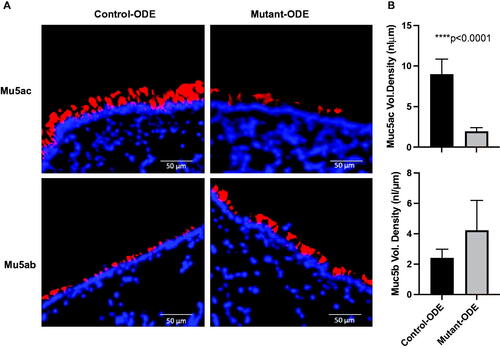
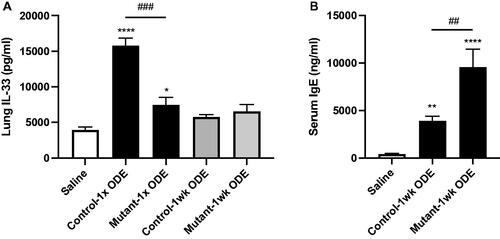
Figure 5. Single (1×) ODE induced-IL-33 release was reduced in mice deficient in lung epithelial MyD88, but serum IgE levels were increased with a 1-week repetitive exposure. (A) Bar graphs depict mean ± SEM of IL-33 levels in lung homogenates from pooled saline animals, control (SPCCre−/− MyD88fl/fl) and mutant (SPCCre± MyD88fl/fl) mice treated once or daily with ODE for 1 week. (B) Serum IgE levels from 1-week treated animals. N = 10 mice/group (saline), N = 7 (control and mutant, 1 week) from at least two independent experimental runs. Statistical differences vs. saline-treated mice are depicted by *p < 0.05, **p < 0.01, ***p < 0.001, and between groups by ##p < 0.01, ###p < 0.001 by ANOVA.