858
Views
38
CrossRef citations to date
0
Altmetric
Original Articles

Optical and radar data integration for land use and land cover mapping in the Brazilian Amazon

, , , &
Pages 301-321 | Received 19 Feb 2013, Accepted 09 May 2013, Published online: 14 Jun 2013

Figures & data

Figure 1. The location of the study area: (a) TM and (b) PALSAR images.

Figure 1. The location of the study area: (a) TM and (b) PALSAR images.

Figure 2. A flowchart of the methodology.

Figure 2. A flowchart of the methodology.

Figure 3. The fusion of SAR and optical images using the PC technique.

Figure 3. The fusion of SAR and optical images using the PC technique.

1 Descriptions of the land use and land cover classes and number of pixels of the training and validation samples.

2 Sets of images to be classified.

Figure 4. The best visual color compositions and their respective classifications of Area 1: (a) TM, (b) PC 1TM_HH, (c) PC 2TM_HH, and (d) PC 1TM_PC 1(HH&HV).
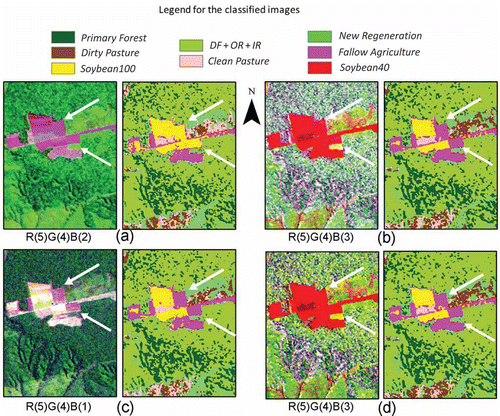
Figure 4. The best visual color compositions and their respective classifications of Area 1: (a) TM, (b) PC 1TM_HH, (c) PC 2TM_HH, and (d) PC 1TM_PC 1(HH&HV).

Figure 5. The best visual color compositions and their respective classifications of Area 2: (a) TM, (b) PC 1TM_HV, (c) PC 1TM_PC 1(HH&HV), and (d) PC 2TM_PC 1(HH&HV).
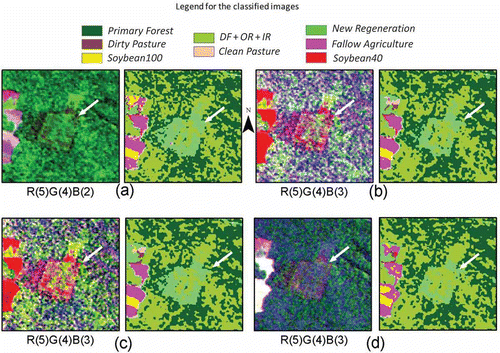
Figure 5. The best visual color compositions and their respective classifications of Area 2: (a) TM, (b) PC 1TM_HV, (c) PC 1TM_PC 1(HH&HV), and (d) PC 2TM_PC 1(HH&HV).

Figure 6. The best visual color compositions and their respective classifications of Area 3: (a) TM, (b) PC 1TM_HV, (c) PC 2TM_HV, and (d) PC 2TM_PC 1(HH&HV).
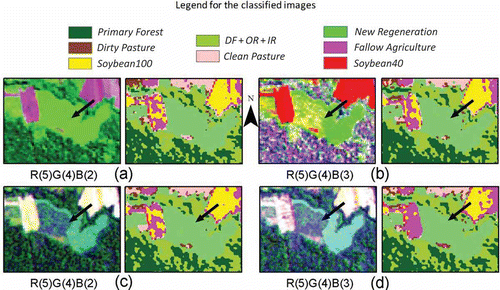
Figure 6. The best visual color compositions and their respective classifications of Area 3: (a) TM, (b) PC 1TM_HV, (c) PC 2TM_HV, and (d) PC 2TM_PC 1(HH&HV).

Figure 7. The best visual color compositions and their respective classifications of Area 4: (a) TM, (b) PC 1TM_HH, (c) PC 1TM_PC 1(HH&HV), and (d) PC 2TM_PC 1(HH&HV).
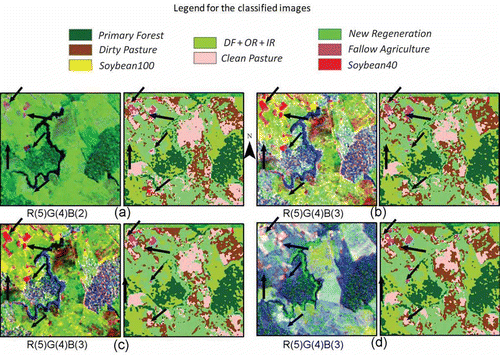
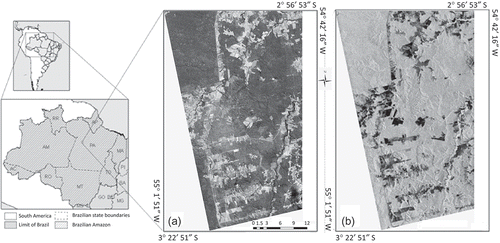
Figure 7. The best visual color compositions and their respective classifications of Area 4: (a) TM, (b) PC 1TM_HH, (c) PC 1TM_PC 1(HH&HV), and (d) PC 2TM_PC 1(HH&HV).
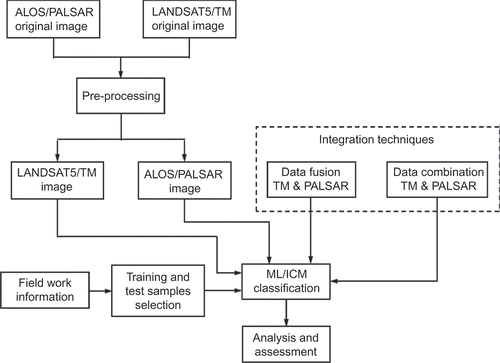
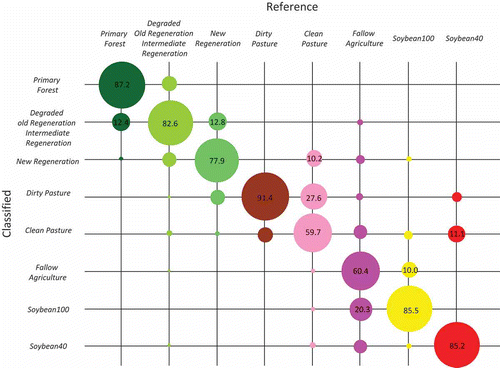
Figure 8. The confusion matrix of the TM classification.

Figure 8. The confusion matrix of the TM classification.

3 Values of the kappa coefficient of agreement per class, global kappa, and overall accuracies for fused and combined image classifications.

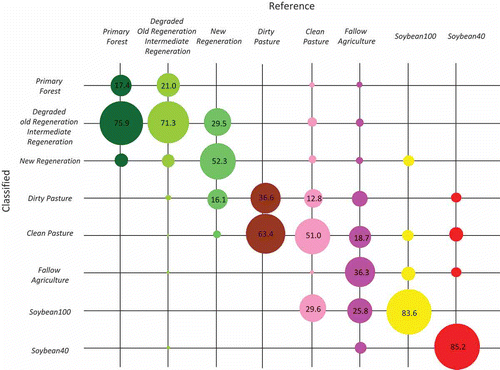
Figure 9. The confusion matrix of the PALSAR classification.

Figure 9. The confusion matrix of the PALSAR classification.

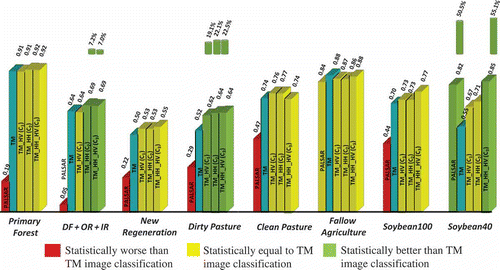
Figure 10. Kappa values per class for classifications with combination of bands.

Figure 10. Kappa values per class for classifications with combination of bands.

4 The producer (PA) and user (UA) accuracies for TM and TM_HH_HV classifications.

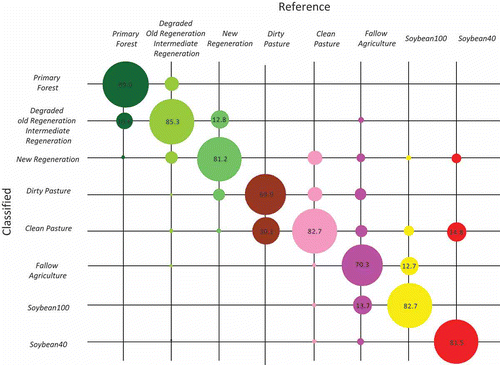
Figure 11. The confusion matrix of the TM_HH_HV classification.

Figure 11. The confusion matrix of the TM_HH_HV classification.

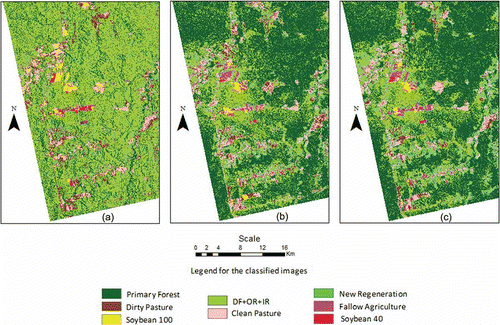
Figure 12. Classified images: (a) PALSAR, (b) TM, and (c) TM_HH_HV.

Figure 12. Classified images: (a) PALSAR, (b) TM, and (c) TM_HH_HV.

Reprints and Corporate Permissions

Please note: Selecting permissions does not provide access to the full text of the article, please see our help page How do I view content?

To request a reprint or corporate permissions for this article, please click on the relevant link below:

Academic Permissions

Please note: Selecting permissions does not provide access to the full text of the article, please see our help page How do I view content?

Obtain permissions instantly via Rightslink by clicking on the button below:

If you are unable to obtain permissions via Rightslink, please complete and submit this Permissions form. For more information, please visit our Permissions help page.