Figures & data
Table 1. DMSP-OLS sensor cluster collection years.
Table 2. Model results by spatial extent and year.
Table 3. MSA scale residual scatter plots.
Table 4. State scale residual scatter plots.
Table 5. MSA outliers by year, method and dependent variable.
Figure 1. Illustration of Levene's equality of means calculation.
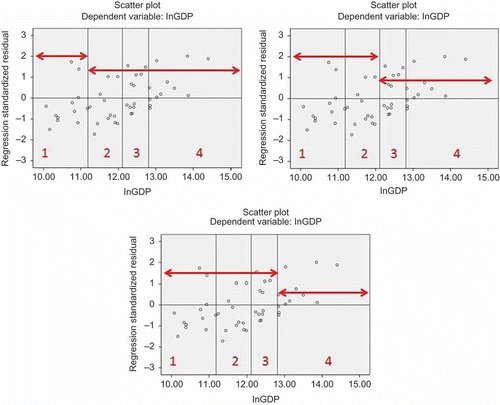
Figure 2. 2006 MSA GWR residuals.
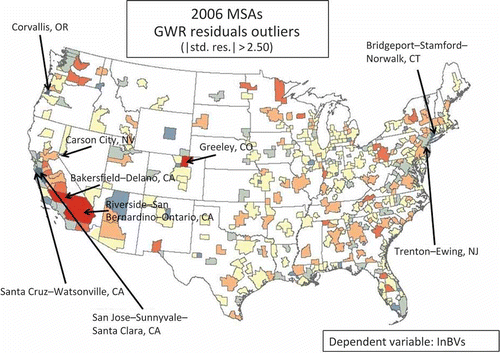
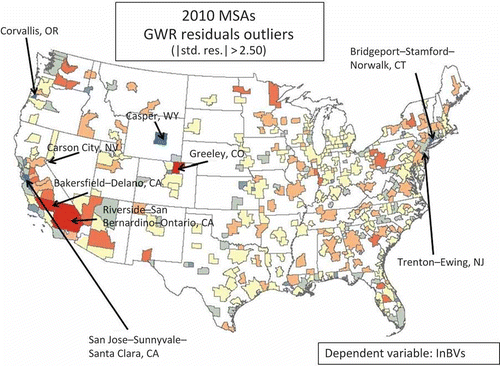
Figure 3. 2010 MSAs GWR residuals map.