Figures & data
Table 1. Potential ecological and environmental applications of time-series NDVI data*
Figure 1. A graphical model for one-step forecasting of 16-day time-series NDVI data.
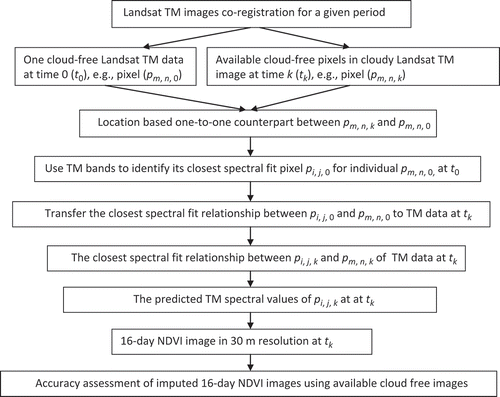
Table 2. Landsat TM images applied to NDVI time-series derivation
Figure 2. TM 20100525: observed versus predicted NDVI image.
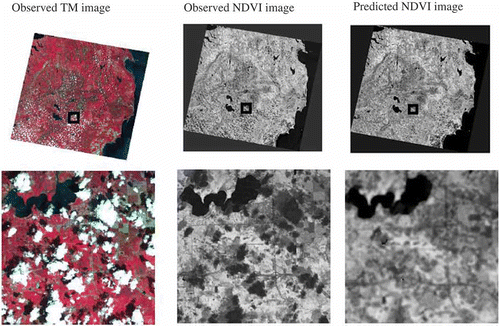
Figure 3. TM 20100914: observed versus predicted NDVI image.
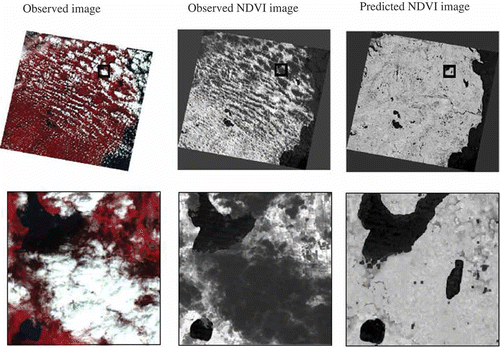
Figure 4. The observed 20100829 NDVI image versus predicted 20100829 NDVI that was generated using predicted TM 20100813 and 20100914.
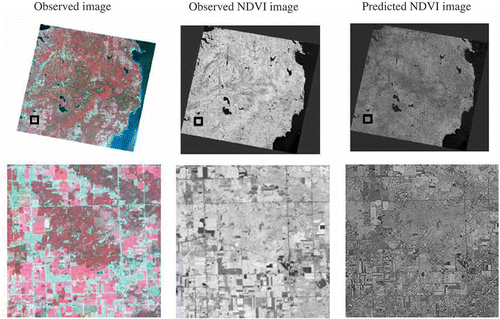
Figure 5. R 2 of linear models regressing the forecast on the observed for bands 4, 3, and 2, and NDVI using 300,000 random pixels in each image 20100423, 20100509, and 20100829.
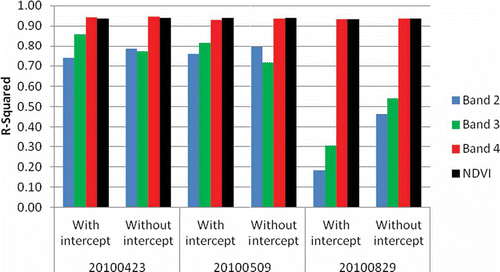
Figure 6. RMSE of linear models regressing the forecasted on the observed using 300,000 random pixels in each image 20100423, 20100509, and 20100829.
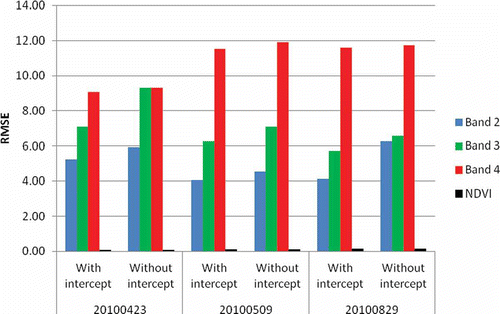
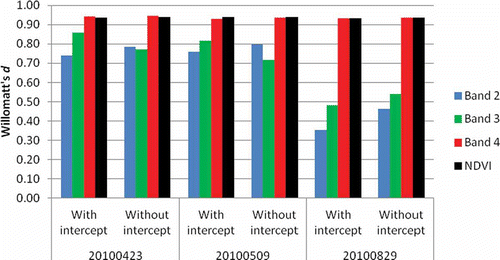
Figure 7. Willmott's index of agreement (d from 0 to 1) for assessment of the forecasted values and the observed values using 300,000 random pixels in each image 20100423, 20100509, and 20100829.