Figures & data
Table 1. Specifications of RapidEye mission (BlackBridge Citation2013).
Figure 1. Study area: Kimje/Cheonbuk (RapidEye true color composition, acquired on 22 September 2011). Red polygons indicate the sample paddies for analysis (119 paddies).
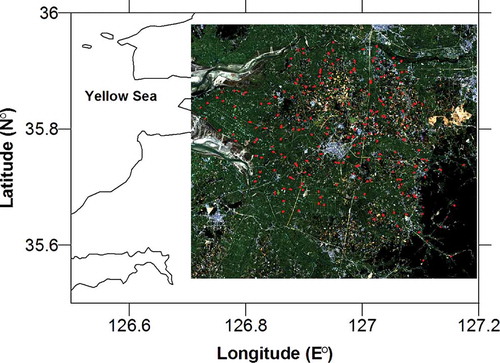
Table 2. Vegetation indices used in this study.
Table 3. Statistics with NDVI by spatial resolution.
Figure 2. Mean comparison of vegetation indices at different spatial resolutions.
Table 4. Statistics with NDVIre by spatial resolution.
Table 5. Statistics with edgNDVI by spatial resolution.
Table 6. Statistics with gNDVI by spatial resolution.
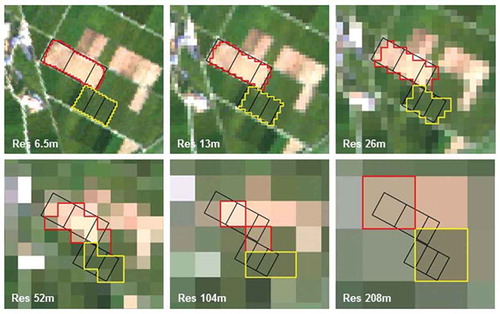
Table 7. Mean number of pixels comprising a paddy segment at each resolution level.
Figure 3. Example of segmentation results as spatial resolution is degraded (red polygon: early transplanted rice, yellow polygon: conventionally transplanted rice, black polygon: paddy units registered in cadaster map).