Figures & data
Figure 1. A flow chart showing the data partition process.
Figure 2. The pseudo codes used to determine the partition pivot.
Figure 3. An example that illustrates how a k-d tree was constructed using different pivots at different levels to partition the whole dataset into 15 child data groups (nodes).
Figure 4. Points that are exactly on the splitting lines were assigned to a subgroup based on its distance to the mean centers (shown by stars) of the adjacent child data groups.
Figure 5. A map showing the study area and the SST observation data in the SCS.
Table 1. Number of SST observations in the six sub-datasets.
Table 2. The global parameters used to interpolate datasets DS-1 to DS-6.
Table 3. Examples of the local parameters used to interpolate child data groups.
Table 4. Machine hardware configuration used in this study.
Figure 6. Comparison of parallel Kriging interpolation results against those produced by sequential Kriging interpolation results of the corresponding bulk datasets.
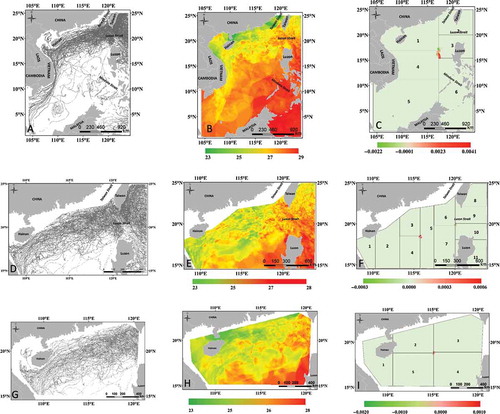
Figure 7. Partition results of datasets DS-4 and DS-6, which were extracted by a planar circle and an irregular polygon, respectively. DS-4 was partitioned into 3(A) and 5(B) groups. DS-6 was partitioned into 2(C) and 5(D) groups.
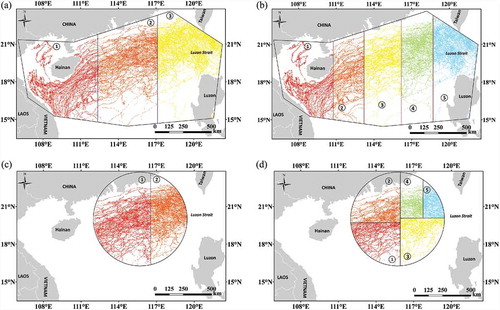
Table 5. Parallel interpolation execution time of dataset DS-1, which was partitioned into 2 to 13 child data groups.
Figure 8. Comparison of the actual number of points in each child data group against the corresponding expectation values.
Figure 9. Data partitioning performance evaluation results of our algorithm as shown by speed-up ratios of execution time between our algorithm and the conventional k-d tree (7A). (B) and (C) The speed-up ratios of execution time of the SDPADH, the SDPAG, and our algorithm, respectively.
Figure 10. Comparison of execution time of parallel versus sequential interpolation: (A) DPAKDT, (B) SDPADH, (C) SDPAG, and (D) average of speed-up ratios of all datasets.