378
Views
4
CrossRef citations to date
0
Altmetric
Articles

Geographically weighted spatial modelling of sediment quality in Lake Okeechobee, Florida

, , &
Pages 366-389 | Received 06 Feb 2014, Accepted 12 May 2014, Published online: 30 Jun 2014

Figures & data

Figure 1. Model selection processes for spatial prediction (OLS: ordinary least square, OK: ordinary kriging; RK: regression-kriging and GWR: geographically weighted regression).
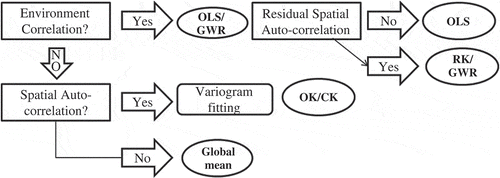
Figure 1. Model selection processes for spatial prediction (OLS: ordinary least square, OK: ordinary kriging; RK: regression-kriging and GWR: geographically weighted regression).

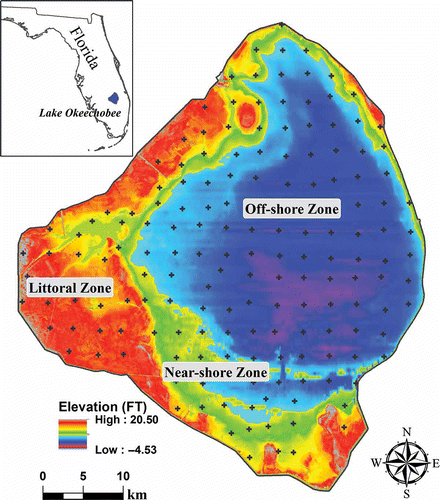
Figure 2. Bathymetry, zones and sample sites of Lake Okeechobee.

Figure 2. Bathymetry, zones and sample sites of Lake Okeechobee.

Table 1. Summary table of nutrients (mg/g), mud thickness (cm) and elevation (ft).

Figure 3. GWR weighting schemes and bandwidths. (a) Fixed weighting scheme. (b) Adaptive weighting schemes.
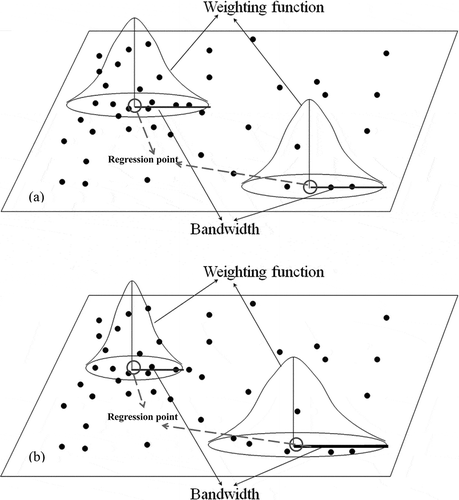
Figure 3. GWR weighting schemes and bandwidths. (a) Fixed weighting scheme. (b) Adaptive weighting schemes.

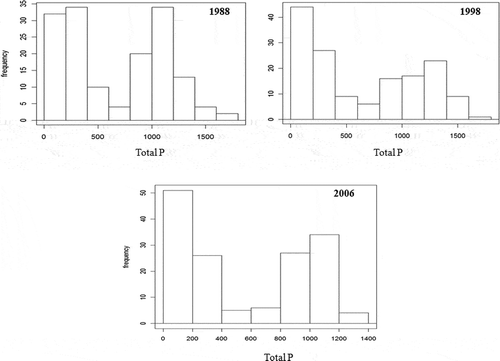
Figure 4. TP histograms (mg/kg) for 1988, 1998 and 2006.

Figure 4. TP histograms (mg/kg) for 1988, 1998 and 2006.

Table 2. Correlation coefficients and their significances of sediment nutrients (mg/kg), mud thickness (cm) and elevation (ft).

Table 3. Statistically significant calibrated OLS models for Iron (Fe) and mud thickness and lakebed elevation (Th & Elev).

Table 4. Analyses of the GWR calibration model (TP vs. Th & Elev).

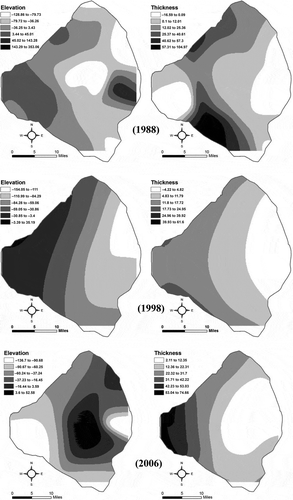
Figure 5. Coefficient maps of the GWR model (TP vs. Th & Elev) calibration for 1988, 1998 and 2006.

Figure 5. Coefficient maps of the GWR model (TP vs. Th & Elev) calibration for 1988, 1998 and 2006.

Table 5. Analyses of the GWR calibration model (TP vs. Fe).

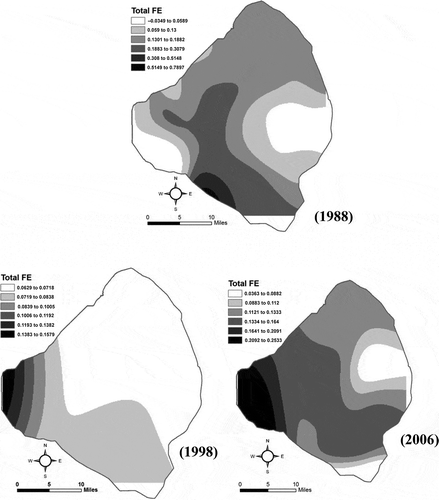
Figure 6. Coefficient maps of the GWR model (TP vs. Fe) calibration for 1988, 1998 and 2006.

Figure 6. Coefficient maps of the GWR model (TP vs. Fe) calibration for 1988, 1998 and 2006.

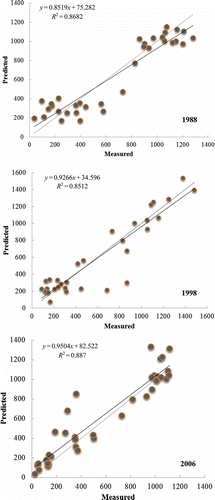
Figure 7. Scatter plots of the GWR models (TP vs. Th & Elev) validation set for 1988, 1998 and 2006.
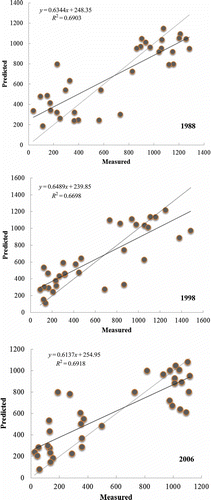
Figure 7. Scatter plots of the GWR models (TP vs. Th & Elev) validation set for 1988, 1998 and 2006.

Figure 8. Scatter plots of the GWR models (TP vs. Fe) validation set for 1988, 1998 and 2006.

Figure 8. Scatter plots of the GWR models (TP vs. Fe) validation set for 1988, 1998 and 2006.

Table 6. Comparison of TP model errors.

Figure 9. TP concentration (a, c and e) (mg/kg) and weights (b, d and f) (kg) estimated using the GWR model (TP vs. Fe) for 1988, 1998 and 2006.
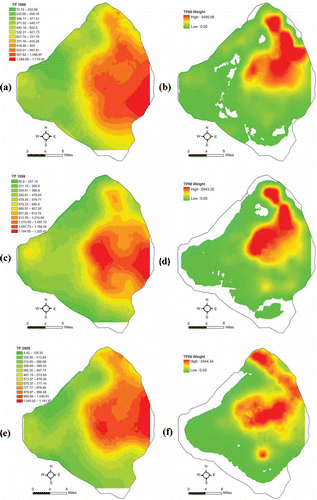
Figure 9. TP concentration (a, c and e) (mg/kg) and weights (b, d and f) (kg) estimated using the GWR model (TP vs. Fe) for 1988, 1998 and 2006.

Figure 10. TP concentration (a, c and e) (mg/kg) and weights (b, d and f) (kg) using the GWR model (TP vs. Th & Elev) for 1988, 1998 and 2006.
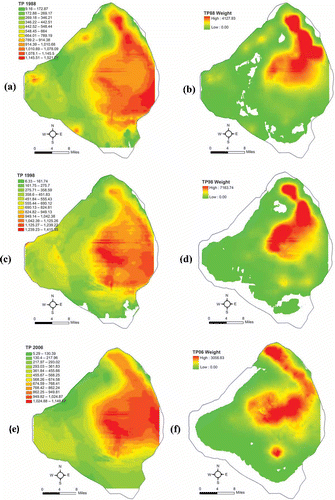
Figure 10. TP concentration (a, c and e) (mg/kg) and weights (b, d and f) (kg) using the GWR model (TP vs. Th & Elev) for 1988, 1998 and 2006.

Table 7. TP mass (kg) and changes over time.

Reprints and Corporate Permissions

Please note: Selecting permissions does not provide access to the full text of the article, please see our help page How do I view content?

To request a reprint or corporate permissions for this article, please click on the relevant link below:

Academic Permissions

Please note: Selecting permissions does not provide access to the full text of the article, please see our help page How do I view content?

Obtain permissions instantly via Rightslink by clicking on the button below:

If you are unable to obtain permissions via Rightslink, please complete and submit this Permissions form. For more information, please visit our Permissions help page.