
Figures & data
Figure 1. Study area map showing the spatial distribution of irrigated and nonirrigated croplands of Nebraska as classified in the Nebraska land use map (left; Dappen et al. Citation2007) and the MIrAD (right; Pervez and Brown Citation2010).
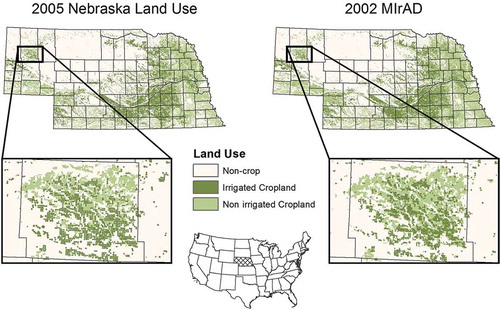
Figure 2. Validation sites for nonirrigated (a, n = 572) and irrigated (b, n = 1238) validation fields. Bold lines are the USDA NASS Agricultural Statistics District boundaries.
Figure 3. Examples of individual validation sites for (a) irrigated fields in western Nebraska and (b) rainfed fields in eastern Nebraska with the centroid (white), interior (transparent), and edge (hatched) pixels used in the various scales of field-level accuracy assessment.
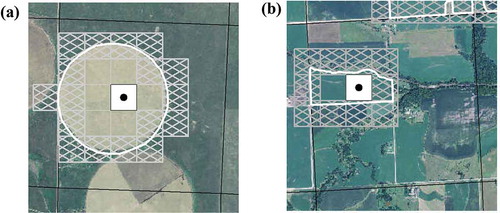
Figure 4. Example of error clusters omitted because of their narrow linear shapes indicative of transitional, mixed pixels between irrigated and nonirrigated areas.
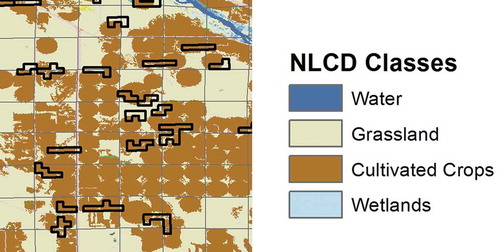
Figure 5. Examples of error types in the MIrAD overlaid on the 2002 Nebraska Cropland Data Layer. (a) The MIrAD irrigated omission clusters in mixed crop and grassland areas, and (b) the MIrAD irrigated commission clusters in soybeans and corn.
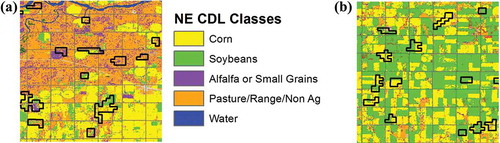
Figure 6. Frequency distribution of ‘core-containing’ and ‘noncore-containing’ ‘disagreement clumps’ by acreage over Nebraska. Numbers relating to ‘noncore-containing clumps’ are in bold.
Table 1. Overall, user’s (UA), and producer’s (PA) accuracy and Kappa results for the field centroids (a), all interior pixels (b), and both interior and edge pixels (c).
Table 2. Overall, producer’s (PA), and user’s (UA) accuracy and Kappa results by field size.