
Figures & data
Figure 1. The city of Nixa and 100-year floodplains.
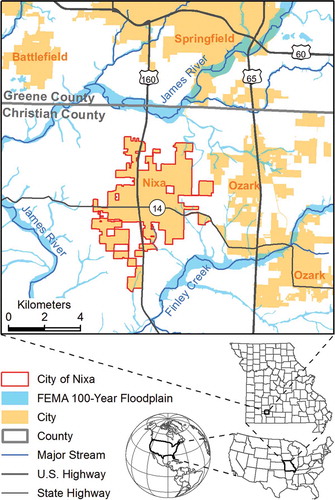
Figure 2. The Ozark Plateau.
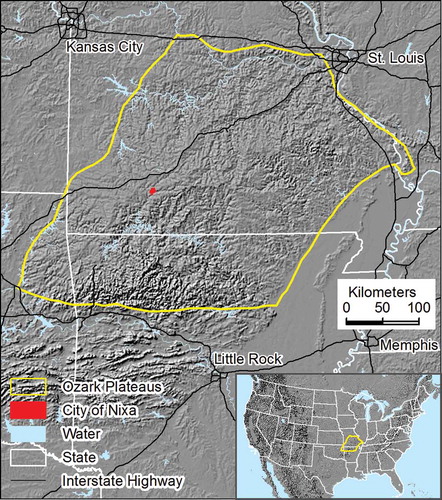
Figure 3. Color infrared NAIP image for the study area and the corresponding parcel land use.
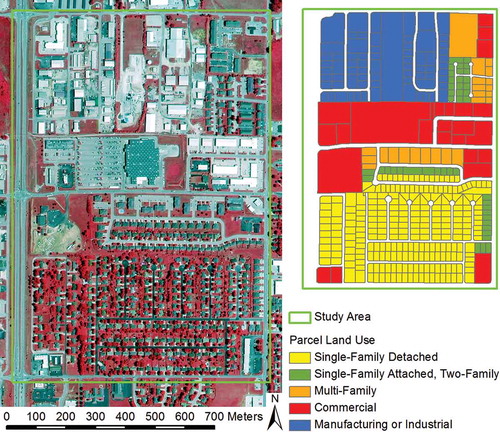
Table 1. A 14-class classification scheme.
Figure 4. Training sample polygons for the 14 classes.
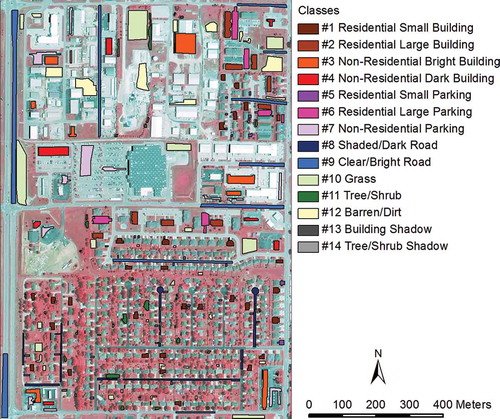
Table 2. Number and proportion of training and validation samples (pixels) for the 14 classes. See for class names.
Figure 5. Eight types of input representations with corresponding pattern widths, referenced to an image of a single-family house.
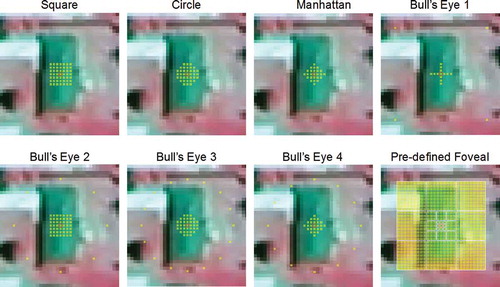
Figure 6. Flow chart of the hybrid classification methodology.
Figure 7. Illustration of the spatial prioritization strategy.
Figure 8. The source NAIP image and extracted residential small buildings based on eight types of input representation (IR).
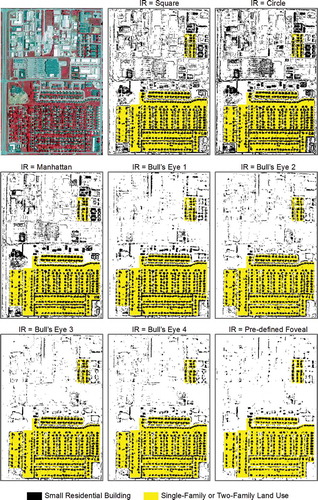
Figure 9. The source NAIP image and extracted grass areas based on eight types of input representation (IR).
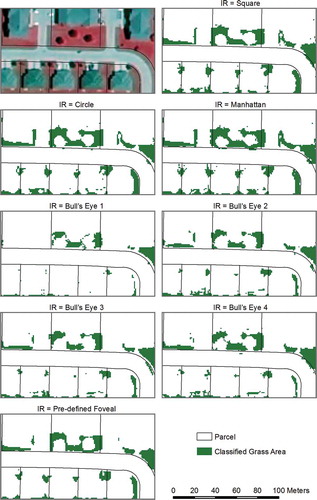
Figure 10. Eight types of input representations with corresponding pattern widths for extracting grass.
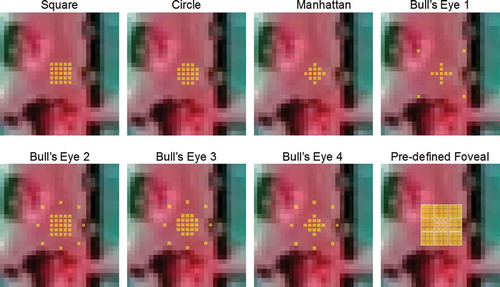
Figure 11. Extracted residential small buildings from 9 pattern widths (PW) based on the Bull’s Eye 3 input representation.
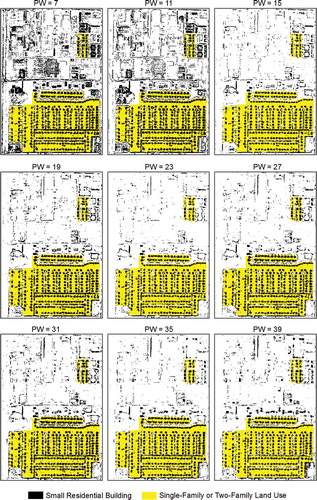
Figure 12. Sample images of residential small buildings referenced at a pattern width of 23 pixels of the Bull’s Eye 3 input representation.
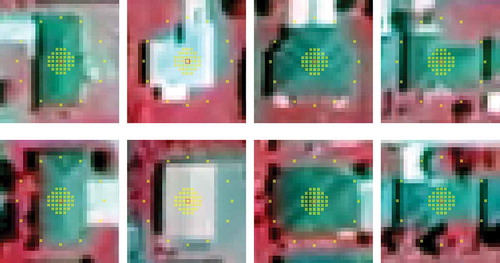
Figure 13. Extracted grass areas from 9 pattern widths (PW) based on the Manhattan input representation.
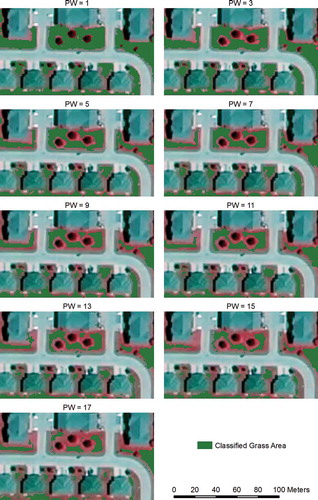
Figure 14. Classification map of 14 urban classes overlaid with 1302 validation samples.
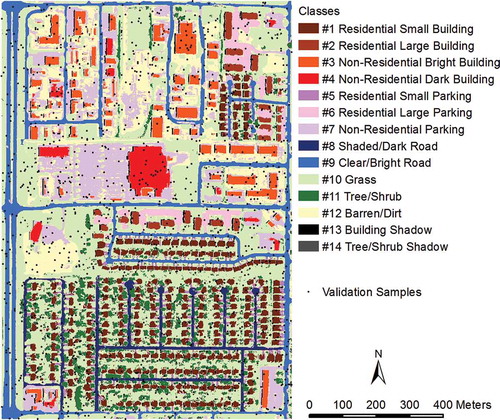
Table 3. Confusion matrix by the number of validation samples. See for class names.