Figures & data
Figure 1. Location map of the Talashil spit, Malvan coast, west coast of India.
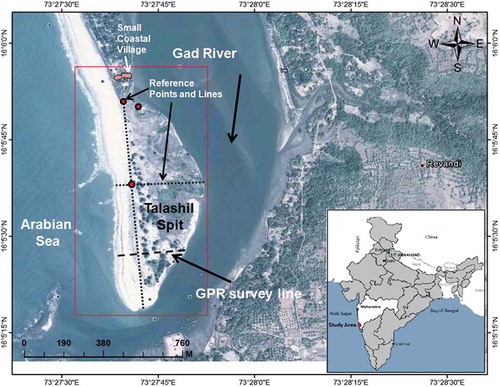
Figure 2. Historical evolution of the Talashil spit from 1973 to 2013. (a) Landsat MSS dated 26-01-1973; (b) Landsat TM 04-02-1989; (c) Landsat TM 14-11-1999; (d) Landsat TM 17-01-2002; (e) IRS P6 07-02-2006; and (f) Digital Globe image (Google Earth) 04-05-2013.
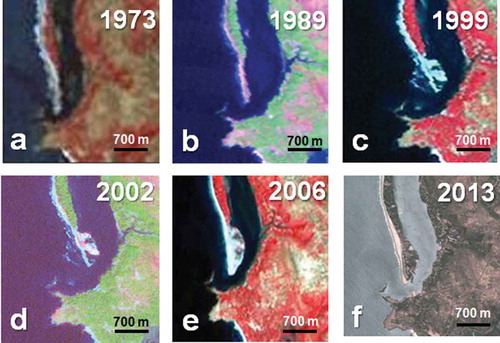
Figure 3. Conceptual sketch on the various stages of formation of Talashil spit; (a1) and (a2) emergence of submerged shoal; (b1) main land with submerged shoals, (b2) sand bar extension and (b3) spit growth. (1) Main land; (2) river; (3) sea; (4) sandbar; (5) river islands; (6) submerged shoals; (7) extended sandbar; (8) submerged river islands near to extended sandbar; and (9) grownup spit.
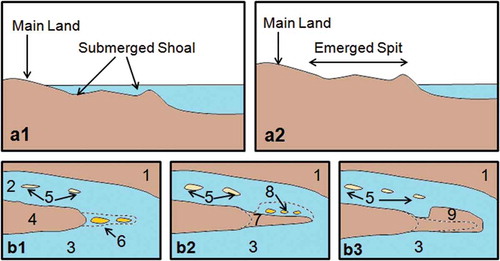
Figure 4. Decadal growth of the spit from 2003 to 2013. (a1) satellite image of 2003; (b1) 2009; (c1) 2011; (d1) 2012; (e1) 2013; and (a2)–(e2) sketches of the spit boundary with respect to years.
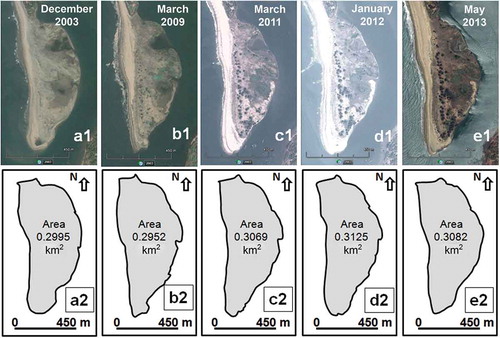
Table 1. Area and perimeter of the spit in various years from 2003 to 2013.
Figure 5. Changes in geomorphic features in 2003 and 2013. (1) Sea shore; (2) dune area; (3a and b) swampy micro-enclosures; (4) lowland; and (5) main land.
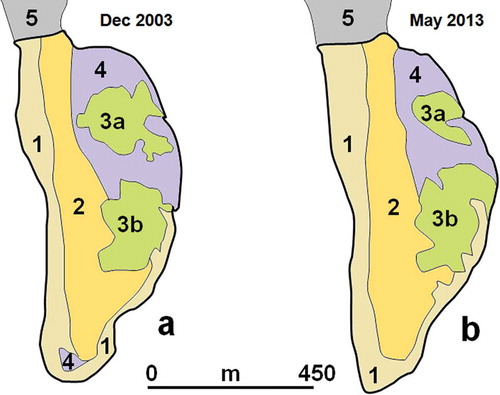
Figure 6. Erosion and accretion locations/zones with reference to different years. (a) Boundary layers of 2003–2009; (b) 2009–2011; (c) 2011–2012; (d) 2012–2013; and (e) 2003–2013.
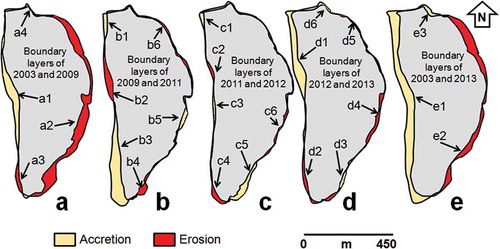
Table 2. Comparison of accretion and erosion from 2003 to 2013 period.
Table 3. Areas under erosion and accretion in the spit at various years (2003–2013).
Figure 7. (a) Comparison of erosion and accretion (2003 to 2013); (b) locations of reverse dynamics around the spit.
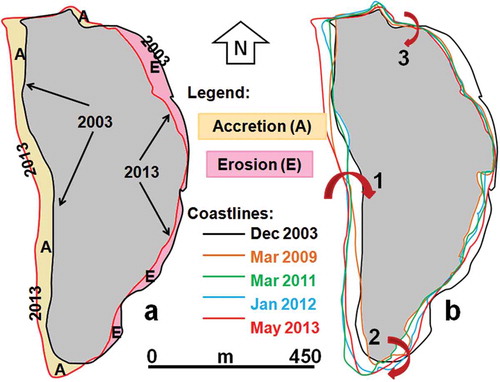
Figure 8. Boundary comparison (2003–2013) of Talashil spit.
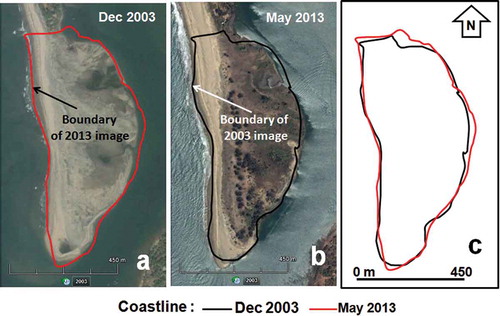
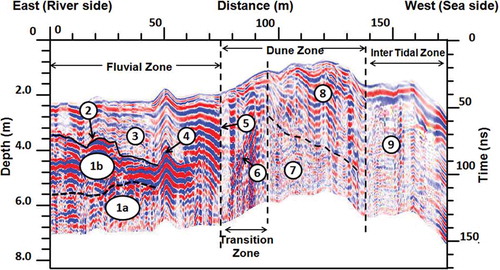
Figure 9. Time domain GPR profile illustrating various subsurface features. (1a) Saturated bottom bed set layers; (1b) compact sand layers; (2) erosional surface; (3) cyclic erosion and accretion zone (unconsolidated upper sand layers); (4) paleo-levee; (5) discontinuity; (6) vertically titled sand layers; (7) dune zone – bottom sand layers; (8) dune zone – upper sand layers; and (9) inter-tidal zone (saturated).