Figures & data
Figure 1. Location of the study area in the Brazilian state of Pará. The ALI/EO-1 bands 5 (775–805 nm), 8 (1550–1750 nm) and 4 (630–690 nm) in red, green and blue colours, respectively, were used in the false colour composite.
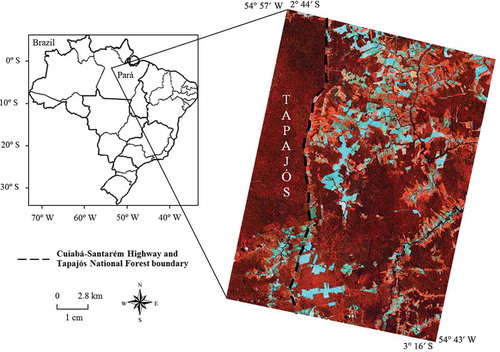
Table 1. Biophysical parameters and species diversity of primary forest (PF) and initial (SS1), intermediate (SS2) and advanced (SS3) stages of secondary succession.
Figure 2. Relative contribution of the eight texture metrics extracted from the ALI/EO-1 bands 3–9 for land-cover mapping using ANN.
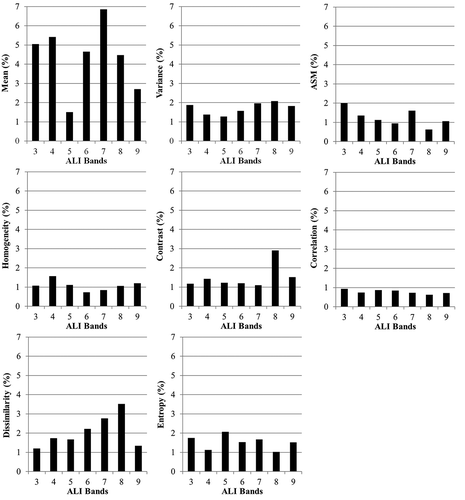
Table 2. Attribute selection of the candidate textural metrics to integrate the combined data set (reflectance plus texture) based on the thresholds of 2.0%, 2.5%, 3.0% and 5.0% of relative contribution, respectively.
Table 3. Confusion matrix from the ANN classification of the spectral input data set (reflectance of the ALI bands 3–9), in % of classified pixels.
Table 4. Confusion matrix from the ANN classification of the combined data set (reflectance plus textural attributes), in % of classified pixels.
Figure 3. Land-cover map derived from the ANN applied to the combined input data set (reflectance plus texture metrics).
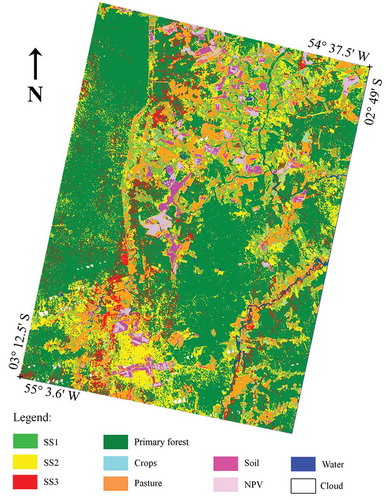
Figure 4. Average surface reflectance and standard deviation values of the ALI/EO-1 bands 6 (845–890 nm) and 8 (1550–1750 nm) for areas mapped with ANN representative of primary forest (PF) and the initial (SS1), intermediate (SS2) and advanced (SS3) stages of secondary succession.
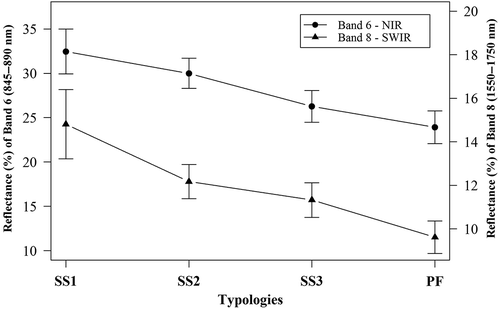
Figure 5. Variation in the ALI/EO-1 texture metrics mean (band 6 = 845–890 nm) and variance (band 8 = 1550–1750 nm) for areas mapped with ANN representative of primary forest (PF) and secondary successions (SS1 to SS3).
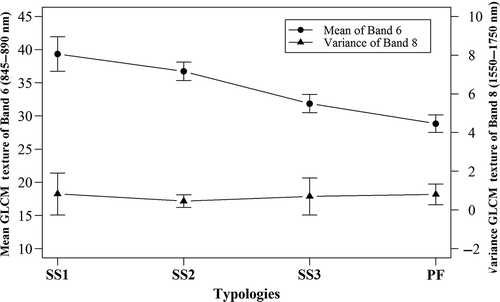
Table 5. Mean and standard deviation values for texture metrics of the ALI SWIR band 8 (1550–1750 nm) for primary forest (PF) and initial (SS1), intermediate (SS2) and advanced (SS3) secondary succession.
Table 6. Pearson’s correlation coefficients for the relationships between the biophysical attributes and the reflectance of the multispectral ALI/EO-1 bands.
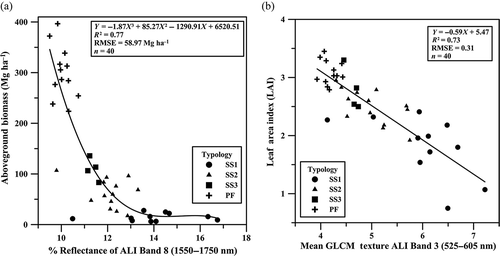
Figure 6. Relationships between (a) the above ground biomass (AGB) and the surface reflectance of the ALI band 8 (1550–1750 nm); (b) the leaf area index (LAI) and the textural metric mean of band 3 (525–605 nm). Results refer to 40 sample plots of primary forest (PF) and secondary successions (SS1–SS3), indicated by symbols.