
Figures & data
Table 1. Description of the land use and occupation classes.
Figure 1. Algorithm 1: segmentation based on cross-entropy minimization by the SCEMA.
Figure 2. Algorithm 2: watershed transformation.
Figure 3. Illustration of the phases of the watershed transformation process (adapted from Beucher (Citation1992)).
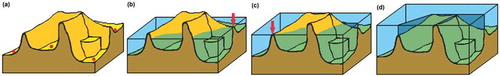
Figure 4. Algorithm 3: max–min.
Figure 5. (a) Image of the study area and (b) image with gradient.
Figure 6. Topography of the gradient image of the study area.

Figure 7. Geographical location of the seeds (a) and the results of the cross-entropy, in the first iteration (b), in the sixth iteration (c) and in the 42nd iteration (d).
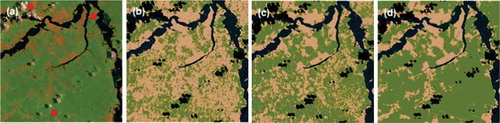
Table 2. Statistical analysis of the comparison between segmentation and manual mapping.
Figure 8. Satellite images used for testing segmentation (left), details of manual mapping of land use and occupation (center), and details of image segmentation (right).
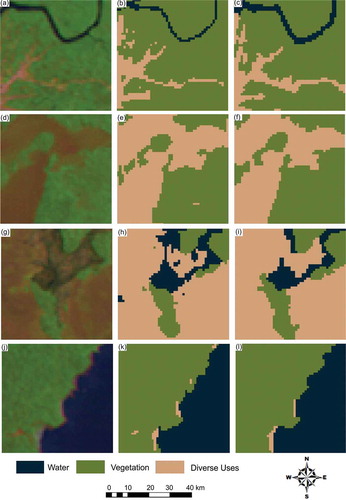
Figure 9. Segmentation of 15 images of a sector of the Amazon region used in this study. (a) Observed concordance = 92.1%, Kappa index = 0.92; (b) observed concordance = 94.2%, Kappa index = 0.94; (c) observed concordance = 93.8%, Kappa index = 0.94; (d) observed concordance = 93.5%, Kappa index = 0.93; (e) observed concordance = 89.5%, Kappa index = 0.89; (f) observed concordance = 85.9%, Kappa index = 0.85; (g) observed concordance = 80.6%, Kappa index = 0.81; (h) observed concordance = 65.1%, Kappa index = 0.64; (i) observed concordance = 69.3%, Kappa index = 0.70; (j) observed concordance = 92.2%, Kappa index = 0.92; (k) observed concordance = 81.2%, Kappa index = 0.81; (l) observed concordance = 90.6%, Kappa index = 0.91; (m) observed concordance = 88.9%, Kappa index = 0.89; (n) observed concordance = 85.9%, Kappa index = 0.86; (o) observed concordance = 65.5%, Kappa index = 0.66.
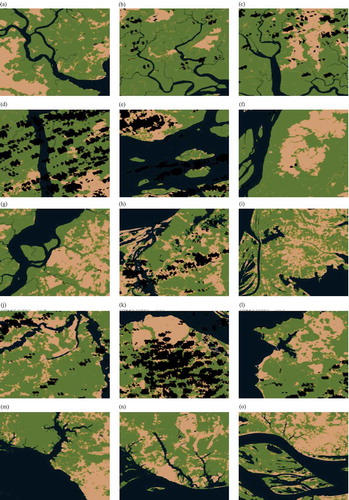
Table 3. Observed correlation in the different segmentation methods.