Figures & data
Figure 1. Location of the study area on the shaded digital elevation map for the Marand plain (lower left) and the geological map (see the Appendix for different acronyms) of the study area (centre).
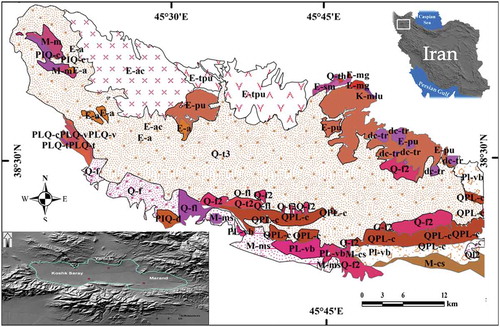
Figure 2. The diagram for whole data processing steps.
Table 1. Interferometric pairs for ASAR data. Bp, Bcr, θ and T indicate the perpendicular, critical, incidence angles and the temporal baseline, respectively.
Table 2. Interferometric pairs for PALSAR data. Bp, Bcr, θ and T indicate the perpendicular, critical, incidence angles and the temporal baseline, respectively.
Figure 3. Example of ionospheric correction on SAR interferograms. Interferogram for pair No. 3 of the PALSAR data-set (a) and its respective azimuth shift map (b); the global TECU map for northwest of Iran (red and magenta rectangles show the extent of ASAR and PLASAR data, respectively) (c) and the effect of ionospheric phase correction on the respective interferogram (d).
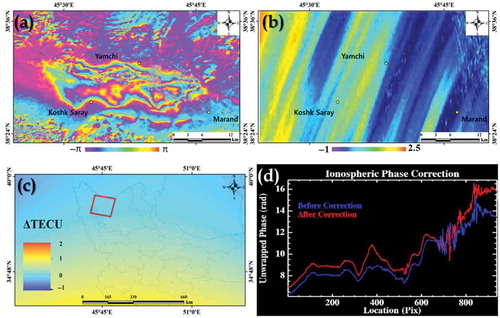
Figure 4. Differential interferogram for pair No. 3 of the PALSAR data-set (a), phase distribution of the respective interferogram before (b) and after (c) atmospheric corrections. Black circles in (a) indicate the three nominating patches out of the deformation areas and the table indicates the statistics related to each patch.
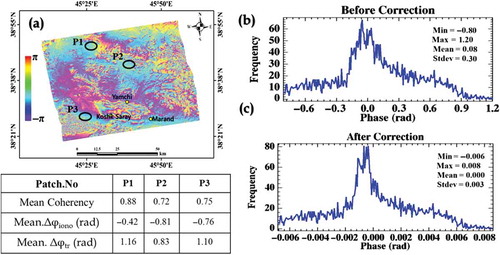
Figure 5. Examples of interferograms generated from ASAR (pair5) and PALSAR data (pair3) in the ascending mode (a and c); mean coherency map for ASAR interferograms in the ascending mode (b) and coherency map for Pair 5 of the PALSAR interferogram (d). The greyish rectangular box in (c) and (d) indicates the region of interest in which the respective coherency percentages were calculated.
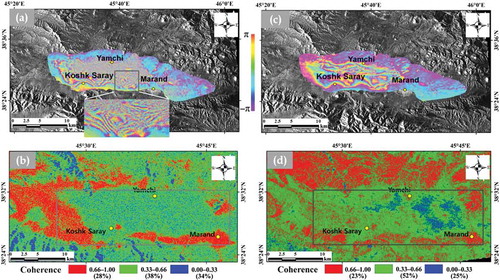
Figure 6. Site location of the study area on the ascending ASAR power image (a). Mean subsidence map for PALSAR (b) and ASAR interferograms (c); horizontal (d) and vertical components of displacement (e).
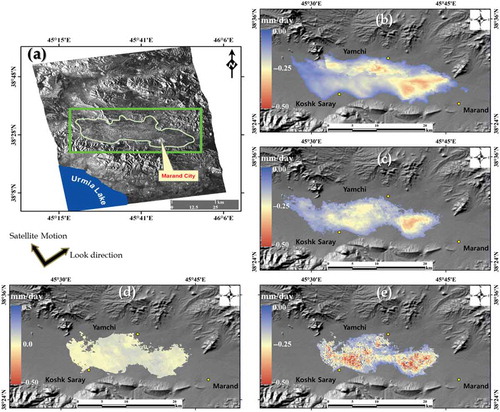
Figure 7. Changes in piezometric levels during 2004–2010 in the Marand plain (a, b and c). The relationship between piezometric fall and mean displacements obtained from D-InSAR measurement over the study area (d).
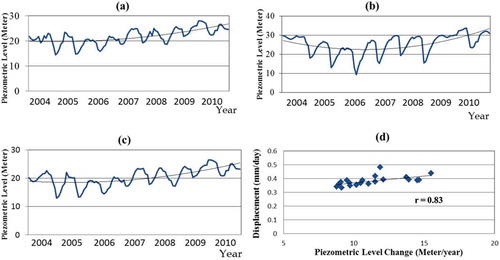
Figure 8. Inter-comparison between the density of pumping wells (number of wells per square kilometre) (a) and spatial patterns of piezometric falls during 2004 to 2010 (b).
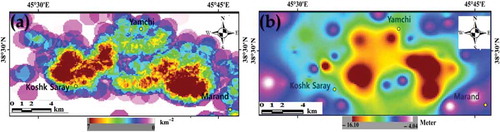
Figure 9. Subsidence evidence in the Marand plain captured during the field visit. Cracks on structures (a), crack and road undulation (b), discarded pumping wells (c) and casing in piezometric boreholes (d).
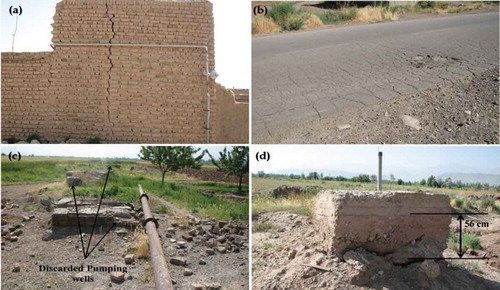
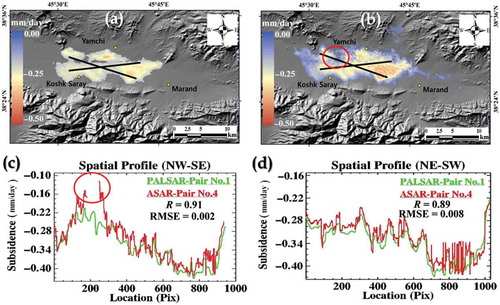
Figure 10. Parity analysis between ASAR and PALSAR subsidence maps during the same temporal span. Subsidence map corresponding to PALSAR-Pair No. 1 (a) and ASAR-Pair No. 4 (b); spatial profiles related to northwest–southeast and northeast–southwest black transect lines on subsidence maps (c) and (d).