Figures & data
Figure 1. The location of the Bohai Sea. For full colour versions of the figures in this paper, please see the online version.
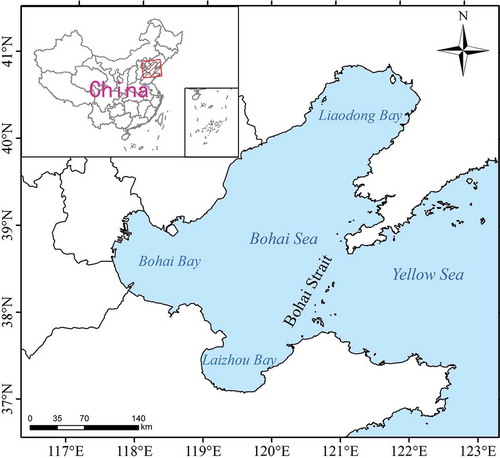
Table 1. The parameters of the HJ-1 CCD.
Figure 2. Images from HJ-1B CCD and ENVSAT ASAR. (a) HJ-1B CCD image (R:3, G:2, B:1), 2% of the linear stretch. (b) 35 samples of level ice on the sea. (c) 5 samples of level ice near the coast. (d) ENVSAT ASAR image, 2% of the linear stretch. (e) 65 samples of rough ice.
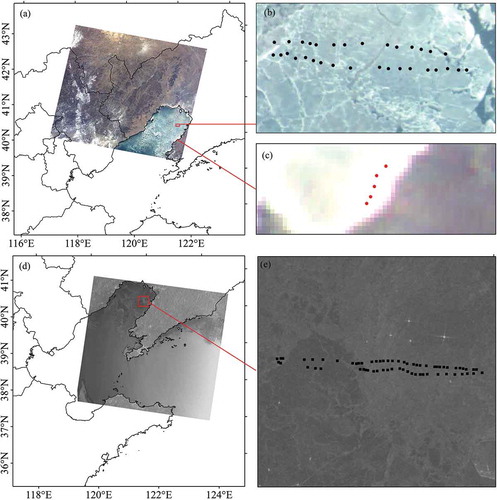
Figure 3. Profile graphs of the level ice and rough ice based on field observations. (a) Profile graph of level ice; (b) profile graph of rough ice; z is the height relative to the average height, and x is the horizontal coordinate.
Figure 4. Histogram of level/rough ice backscattering coefficient.
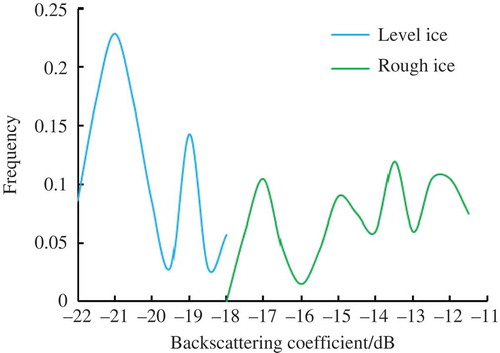
Figure 5. The extents of sea ice, level ice and rough ice. (a) Extracted from HJ-1 CCD and ASAR images; (b) extracted from MODIS image acquired on 14 February 2011 02:30 am UTC.
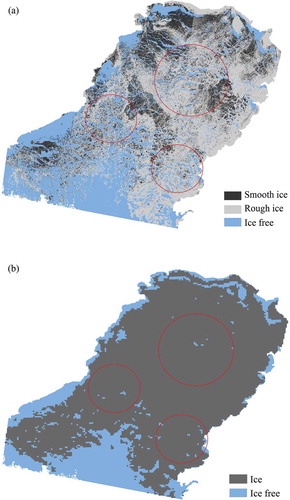
Figure 6. Relationship between the thickness of the level sea ice and the reflectance and the relationship between the thickness of rough sea ice and the backscattering coefficient. (a) Relationship between the thickness of the level sea ice and reflectance; (b) relationship between the thickness of rough sea ice and the backscattering coefficient. The blue circles represent the field measurements; the pink line is the fitted curve; the deep pink region corresponds to the 95% confidence interval, and the light pink region corresponds to the 68% confidence interval.
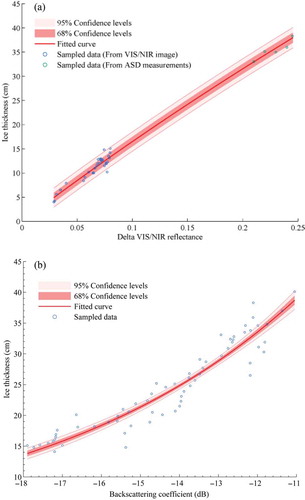
Table 2. Goodness of the fit.
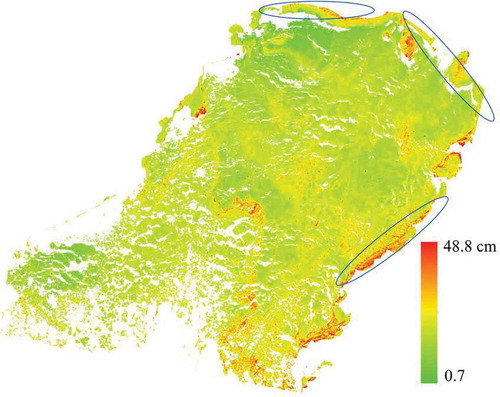
Figure 7. The map of the sea ice thickness in the Bohai Sea.