Figures & data
Figure 1. Schematic of the SETSM algorithm. The nth level of the image pyramid is automatically determined based on the ground sample distance (GSD) of the image.
Table 1. WorldView-1, 2 and Pleiades satellite specifications.
Figure 2. Footprint of WorldView images and ILATM1 B data-set on west Greenland. Red, green, blue and cyan colors indicate 2010, 2011, 2012 and 2013 year, respectively. (a) Scene center coordinates of stereo pairs and strips connecting each other by lines. (b) Trajectories of LiDAR elevation data. The map axes are in polar stereographic projection with units of meters. For full colour reproduction, please see the online version of this paper.
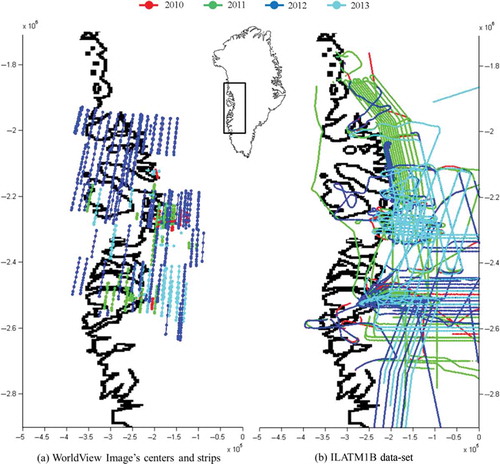
Figure 3. Control points for calculating the translational offset. (1) and (2) are seventh stereo pair along WV01_20110605 strip and third stereo pair along WV01_20120422 strip, respectively. Parts (a) and (b) show the ILATM1 B data over SETSM DEM and control points over orthorectified image, respectively.
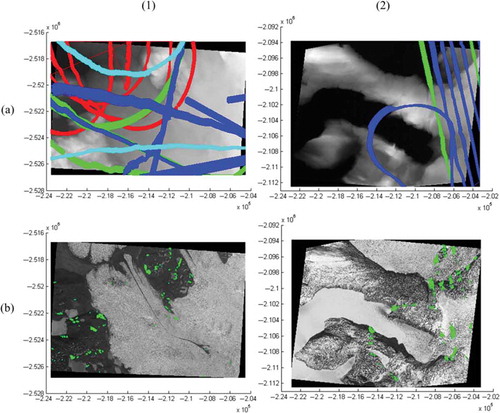
Table 2. SETSM DEM accuracy with ILATM1 B data-set through the co-registration algorithm. The name of Strip ID is composed of satellite type and date of imagery.
Figure 4. Outlet glaciers of (1), (2) and (3) are located in 66.94° N and 49.92° W, 67.07° N and 50.20° W, and 70.63° N and 50.65° W, respectively. The stereo pairs have been taken on 5 June 2011 by WorldView-1, 19 August 2010 by WorldView-2 and 22 April 2012 by WorldView-1, respectively. Part (a) shows the hill-shaded images of DEMs. Parts (b) and (c) show the cross section profiles (A) and (B), respectively. A polar stereographic projection is used with units of meters.
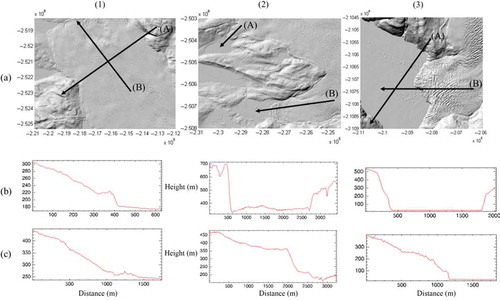
Figure 5. (1) and (2) indicate the Surpraglacial lake located in 67.95° N and 48.72° W and the rivers located in 69.24° N and 150.49° W, respectively. The stereo pairs have been taken on 28 November 2011 and 15 June 2012 by WorldView-1, respectively. Part (a) shows the hill-shaded images of DEMs. Parts (b), (c) and (d) show cross section profiles (A), (B) and (C), respectively. A polar stereographic projection is used with units of meters.
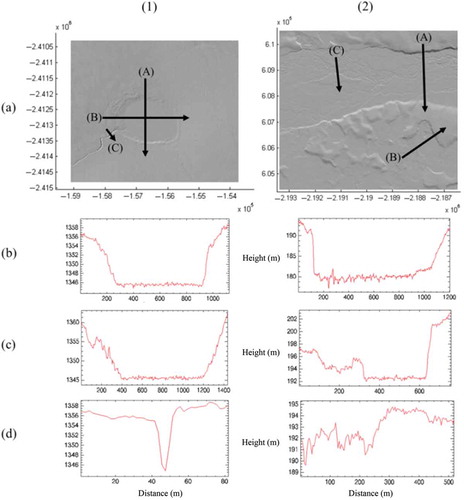
Figure 6. Mountainous region DEMs of Alaska are located in 68.05° N and 149.69° W. Stereo pairs have been taken on 10 September 2008 by WorldView-1. Arrows indicate shadowed regions. A polar stereographic projection is used with units of meters.
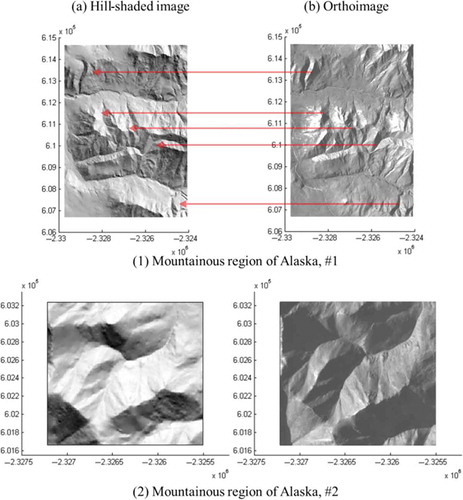
Figure 7. East of ice cap DEMs in Baffin Island, Canada (70.05° N and 73.39° W).
Figure 8. Dry valley DEMs of (1) and (2) are located in 77.74° S and 162.10° E, and 77.69° S and 160.58° E at Antarctica, respectively. Stereo pairs have been taken on 1 November 2009 by WorldView-1. Part (a) shows the hill-shaded images of DEMs. Parts (b) and (c) show the cross section profiles (A) and (B), respectively. A polar stereographic projection is used with units of meters.
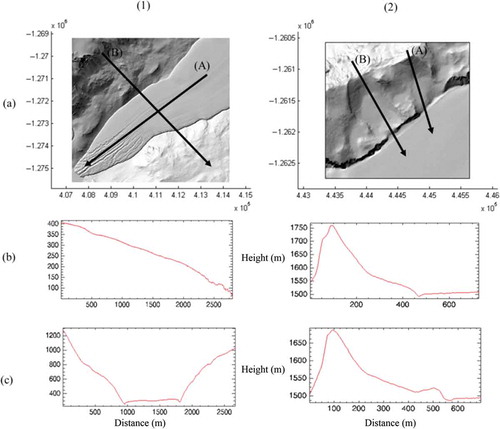
Figure 9. Three-dimensional views with SETSM DEMs and orthoimages.
Figure 10. SETSM DEM of Astrolabe Glacier, Antarctica (66.77° S and 139.78° W) from Pleiades imagery. Stereo pair has been taken on 2 February 2013. Parts (c), (d) and (e) show the hill-shaded images of patches (A), (B) and (C), respectively. A polar stereographic projection is used with units of meters.
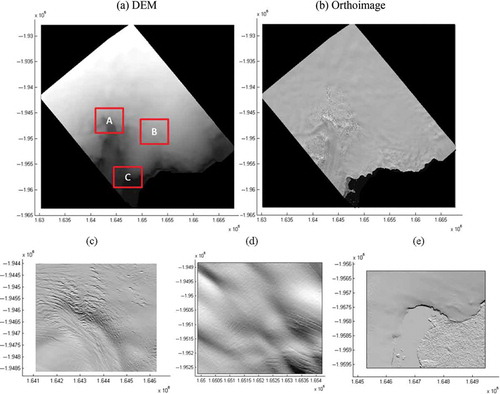
Figure 11. Surface elevation change with SETSM DEMs over large calving glacier. Parts (a) and (b) show the orthorectified images taken on 19 March and 3 April 2013 by WorldView-2, respectively. Dots on (a) are the control points for co-registration. Part (c) is the height difference map calculated as DEM(20130403) – DEM(20130319) over all area. Parts (d), (e) and (f) show the enlarged DEM1(20130319), DEM2(20130403) and height difference map over area (A) calculated as DEM2 – DEM1, respectively. A polar stereographic projection is used with units of meters.
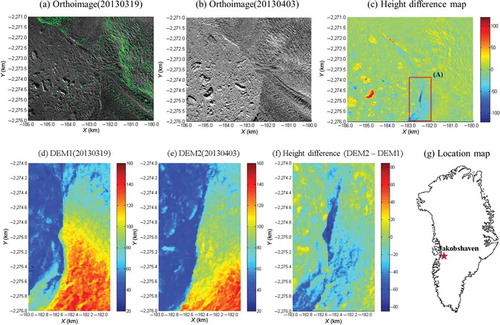
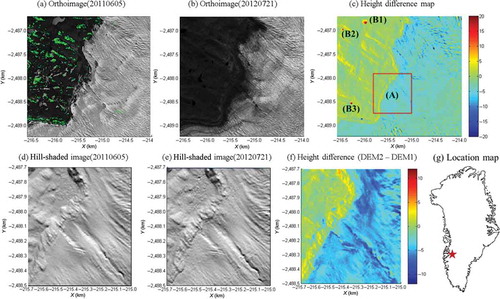
Figure 12. Surface elevation change with SETSM DEMs over an area of land-terminating margin. Parts (a) and (b) show the orthorectified images taken on 5 June 2011 and 21 July 2012 by WorldView-1, respectively. Dots on (a) are the control points for co-registration. Part (c) is the height difference map calculated as DEM(20120721) – DEM(20110605) over all area. Large errors labeled B1, B2 and B3 are caused by frozen lake surfaces in the first DEM that were unfrozen in the second. Parts (d), (e) and (f) show the enlarged hill-shaded image of 20110605 and 20120721, and height difference map over area (A) calculated as DEM2 – DEM1, respectively. A polar stereographic projection is used with units of meters.