Figures & data
Table 1. DEM datasets evaluated in this study.
Figure 1. Location of the study area within the 7.5′ topographic quadrangle. For full color versions of the figures in this paper, please see the online version.
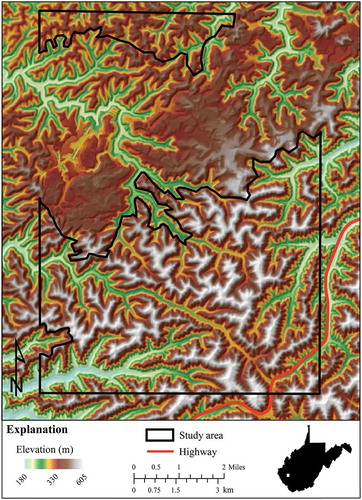
Figure 2. Error rasters generated from the LiDARDEM minus each DEM calculation. (A) LiDAR – DLGDEM; (B) LiDAR – SRTMDEM; (C) LiDAR – GDEM; (D) LiDAR – SAMBDEM.
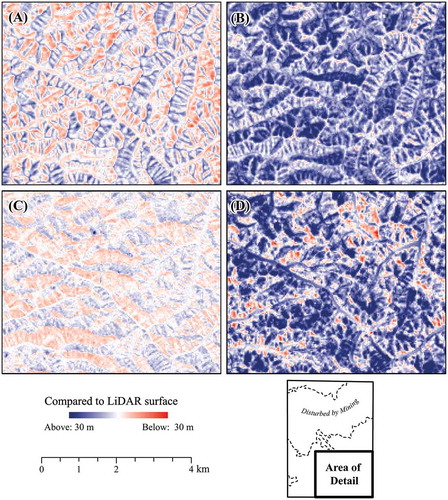
Table 2. OLS regression of elevation and error, slope and error, and aspect and error. There is a positive, significant relationship between elevation and error in the DLGDEM and SRTMDEM and between slope and error in the SRTMDEM.
Table 3. Descriptive statistics of the error values in meters for each DEM, broken out by land cover.
Figure 3. Histograms of the number of grid cells with values in increments of 5 m, for each DEM.
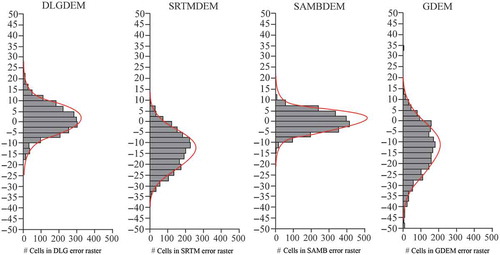
Table 4. Statistical measures of each error raster. Error rasters with a non-normal distribution are highlighted in gray; however, both normal and non-normal measures are calculated for all error rasters. While the majority of these statistical measures utilize the signed difference in elevation between the reference surface and the tested DEM surface (indicated by ∆h), the non-normal error distribution measures of the 68.3 percentile and the 95th percentile show the absolute value of the errors (indicated by ).
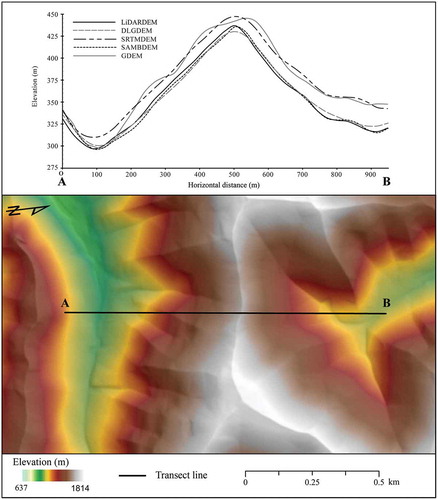
Figure 4. Comparisons of the DEM along a transect across a ridge.