Figures & data
Figure 1. a. Moderate Resolution Imaging Spectroradiometer composite image of the study area and in situ survey and bottom topography in the Amundsen Sea coast, West Antarctica. b. Detailed bathymetry beneath Thwaites and its eastern Ice Shelves.
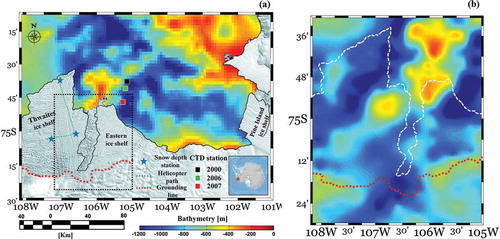
Table 1. The specification of remote sensing data used in this study.
Figure 2. Landsat 7 ETM+ images from 2000 to 2012, shown by the black dotted box in . The hatched pattern is the result of the failure of the Scan Line Corrector (SLC) of Landsat in 2003, according to the statement from the United States Geological Survey.
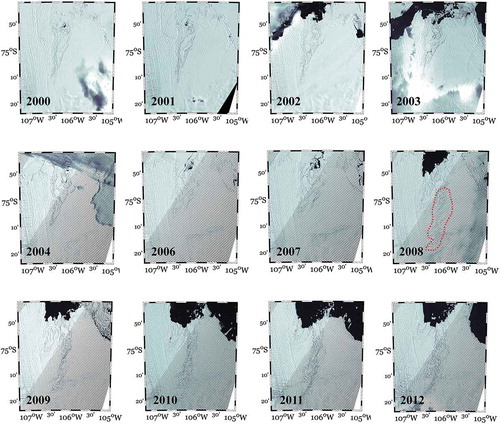
Figure 3. Spatial distribution of the shear and rift zones between Thwaites and its eastern ice shelf.
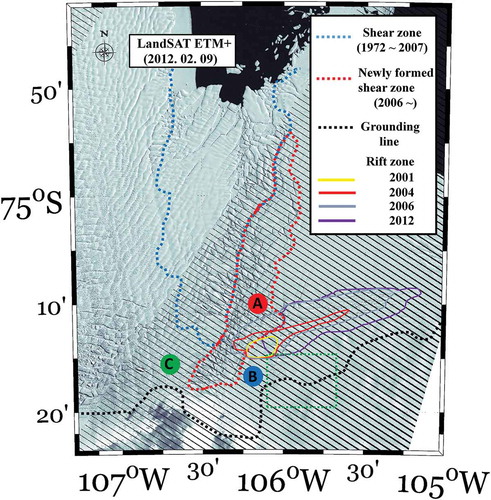
Figure 4. Variations of ice flow velocities at various locations on Thwaites Ice Shelf derived from multi-temporal Landsat images acquired from 2000 to 2012, except 2005.
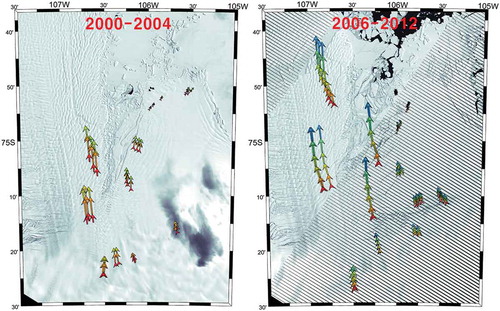
Figure 5. Mean ice flow speeds estimated from time series of Landsat data (from 2000 to 2012, except 2005) at three sites (A, B, and C) shown in .
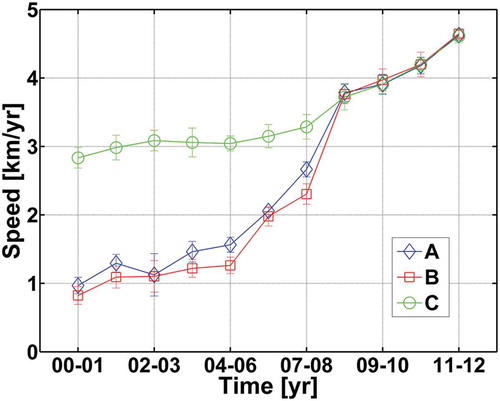
Figure 6. Profiles of conductivity–temperature–depth (CTD) data shown in . The solid and dashed lines indicate observed temperature–freezing temperature (T–Tf) and observed salinity, respectively.
Figure 7. Comparisons of crevasse patterns in TerraSAR-X and GeoEye-1 images captured on 25 September 2009, and 27 January 2010, respectively, shown by the green dotted box in .
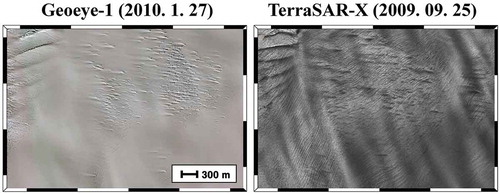
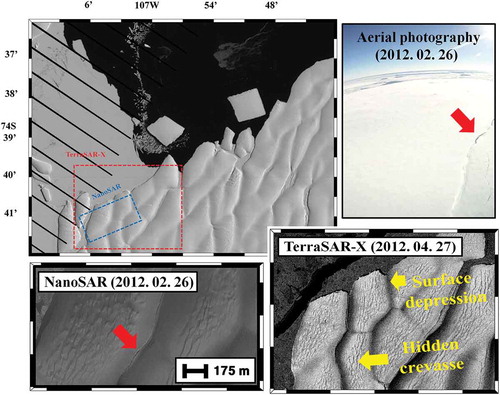
Figure 8. Comparisons of crevasse patterns in Landsat 7 ETM+, aerial photography, and spaceborne SAR images near the grounding line of Thwaites Ice Shelf.
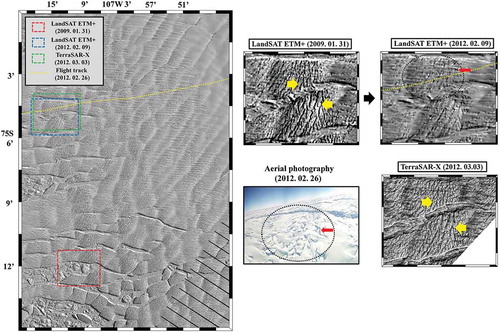
Figure 9. Comparisons of crevasse patterns in Landsat 7 ETM+, aerial photography, airborne, and spaceborne SAR images of Thwaites Ice Shelf terminus.