Figures & data
Figure 1. Study areas and selected points in each area: (A) the Cascade Range in the western Washington; (B) the Ozark Plateau in the southern Missouri; and (C) the loess-till plains in the northern Missouri. Triangles in each panel indicated the selected points used to determine fixed-area local relief, watershed relief, and watershed mean local relief.
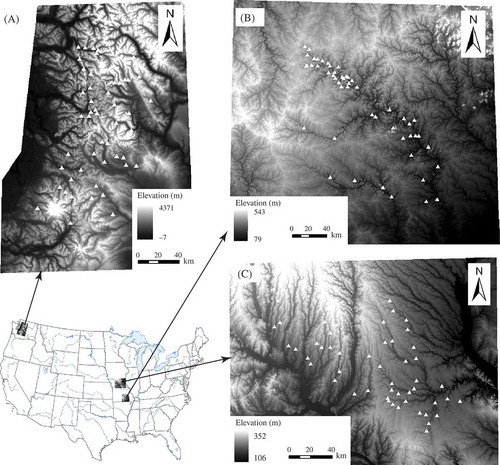
Figure 2. Diagrams illustrating the three relief parameters used in this study: (A) fixed-area local relief defined as the maximum elevation difference around a target point using a circular analytical window; (B) watershed relief defined as the maximum elevation difference within a watershed; and (C) watershed mean local relief defined as the averaged fixed-area local relief of all cells within a watershed using a specified analytical window. Two steps are needed to derive this parameter: (1) creating an elevation range raster (fixed-area local relief for each cell) from the DEM based on the specified window; and (2) extracting all values with the watershed to calculate the watershed mean local relief. For full color versions of the figures in this paper, please see the online version.
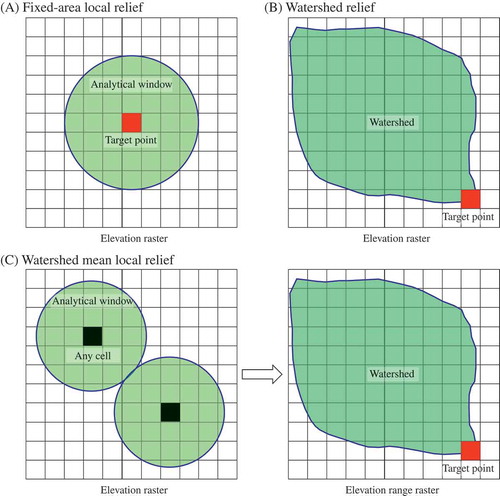
Figure 3. An ArcGIS flowchart to delineate the watershed boundary for a target point.
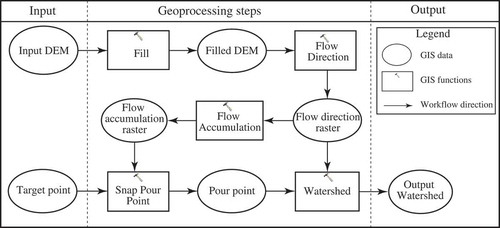
Figure 4. Relationships between fixed-area local relief and analytical window. Panels A, B, C are for the mean relief value; panels D, E, F are for the coefficient of variation (CV); and panels G, H, I are for the correlation coefficient (r) between the relief values of each window and the values of the 10-km analytical window (the p-values of most correlations are <0.01). The left three panels (A, D, G) are for the Cascade Range in the western Washington; the middle three panels (B, E, H) are for the Ozark Plateau in the southern Missouri; and the right three panels (C, F, I) are for the loess-till plains in the northern Missouri. Different curves in each panel are from different DEM resolutions.
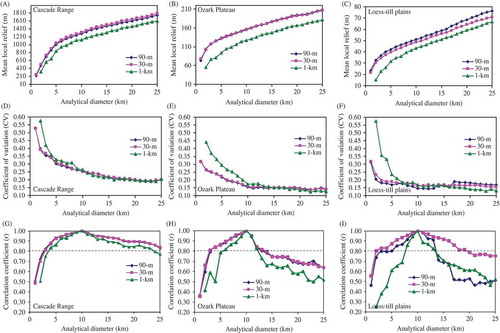
Figure 5. Relative differences between 90-m, 1-km, and 30-m DEMs and their variations in different analytical windows: (A) the Cascade Range in the western Washington; (B) the Ozark Plateau in the southern Missouri; and (C) the loess-till plains in the northern Missouri. Different curves in each panel are for different DEM resolutions.
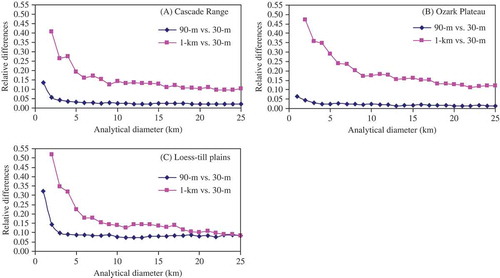
Table 1. Relative difference of normalized watershed reliefs of 90-m and 1-km DEMs compared to the reference value derived from the 30-m DEM (calculated as the ratio of the absolute difference to the reference value).
Table 2. Correlation coefficient (r) between watershed mean local relief values derived using different diameters. The left, middle, and right values (separated by “/”) are for different DEM resolutions of 30-m, 90-m and 1-km, respectively (the p-values for all correlations are <0.01).
Table 3. Correlation coefficient (r) between the normalized watershed mean local relief of each analytical window (diameter) and the normalized watershed relief (both are normalized by the square root of the watershed area. The p-values for all correlations are <0.01).
Figure 6. Relationships between watershed relief and watershed mean local relief (both are normalized by the square root of the watershed area) derived using a 10-km-diameter window for two watershed area groups of <80 km2 (11 watersheds) and >200 km2 (12 watersheds) in the Cascade Range of the western Washington.