
Figures & data
Figure 1. (a) Distribution of reflectance values in SNIR-R. (b) The migration of a single vegetated pixel in SNIR-R during a growing season (Jensen Citation2009). For full colour versions of the figures in this paper, please see the online version.
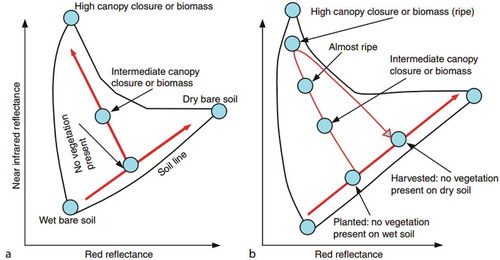
Table 1. The information about five sites of BigFoot campaign (study area).
Table 2. Information on LAI field measurements.
Figure 2. BigFoot field sampling design (+ signs represent points where LAIs are measured).
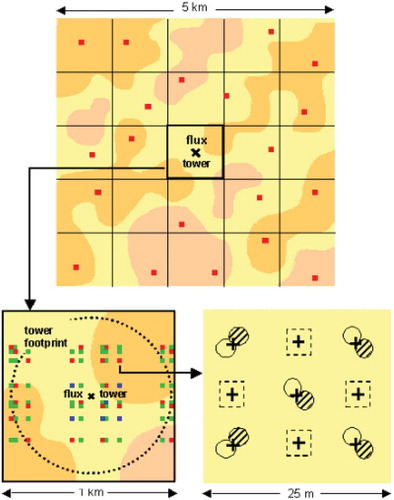
Table 3. The information about ETM+ images used in this study.
Figure 3. Nine parameters used for estimation of LAI in this study (four angles and five distances).
Table 4. The correlation (R2 values) between in situ measured LAI with each of the nine parameters, using linear, polynomial (second order), exponential, logarithmic, and power equations.
Table 5. Information of five soil lines suggested by different workers.
Table 6. Reflectance information for various dry soils.
Figure 4. Plots of nine mentioned parameters against in situ measured LAI.
Figure 5. Different dry soil positions in SNIR-R and selection of Point B.
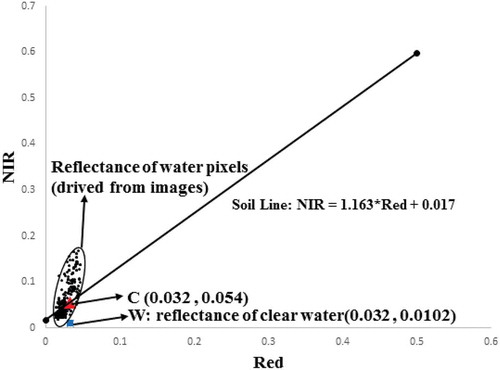
Figure 6. The method of choosing Point C.
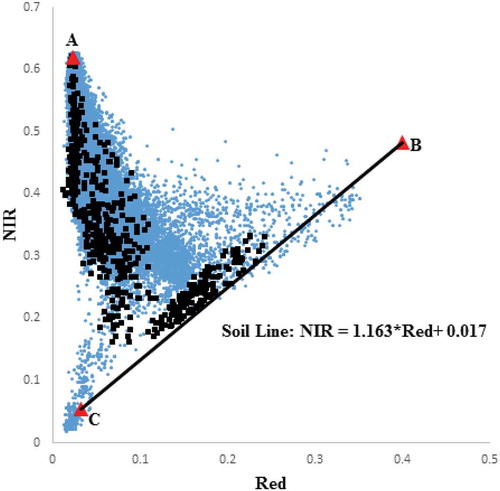
Table 7. The information about six best fits among 511 different combinations of regression equations for estimation of LAI.
Figure 7. Measured versus 5P-LAI3 model predicted values of LAI. Diagonal is 1:1.
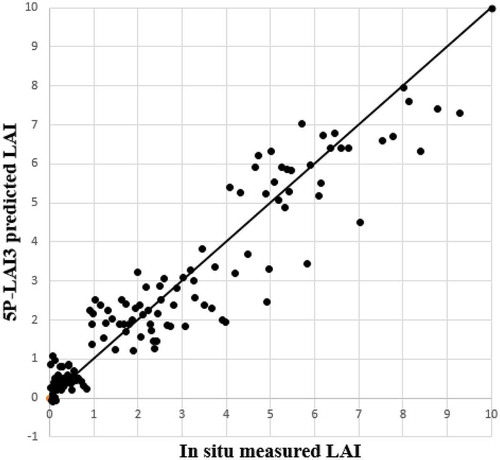
Figure 8. Variation of the absolute error and relative error for different values of LAI test data.
Figure 9. Three regression equations in three different regions of the triangle in the SNIR-R. Diagonal is 1:1.
Table 8. Confusion matrix for LAI estimation in three classes of values.
Figure 10. The estimated LAI values by TSM against in situ measured data. Diagonal is 1:1.
Table 9. Comparison between the models proposed in this study with other models in which the BigFoot data are used.