Figures & data
Figure 1. Showing the location of Chandra and Bhaga basins. For full color versions of the figures in this paper, please see the online version.
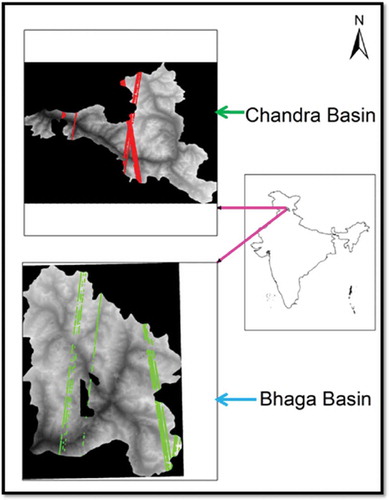
Figure 2. Distribution of GLAS points with slope in Chandra and Bhaga basins.
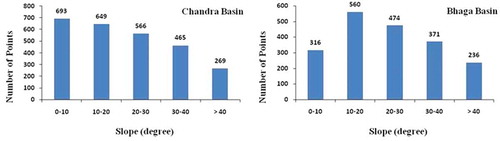
Figure 3. Relationship between local slope, coordinate offsets, and the height difference.
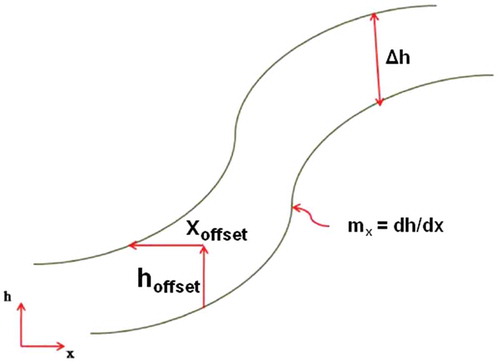
Figure 4. Gaussian distribution function with varying mean (b) and variance (σ2).
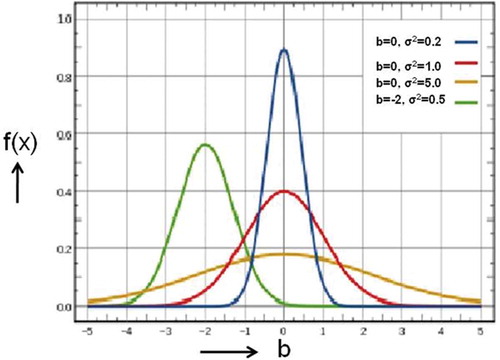
Table 1. Impact of number of random points (sampling ratio) on the co-registration parameters in Chandra basin.
Table 2. Impact of number of random points (sampling ratio) on the co-registration parameters in Bhaga basin.
Figure 5. Box plot for each sampling ratio for Chandra (a) and Bhaga (b) basins.
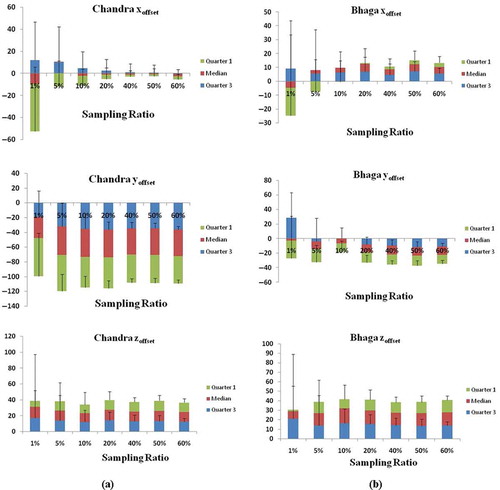
Table 3. Gaussian parameters before and after bias correction for Chandra and Bhaga basins.
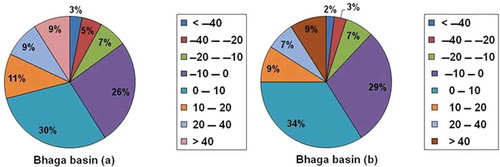
Figure 6. Vertical error distribution for Chandra basin in original DEM (a) and rectified DEM (b).
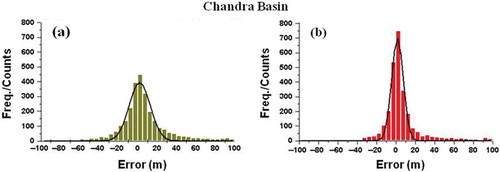
Figure 7. Vertical error distribution for Bhaga basin in original DEM (a) and rectified DEM (b).
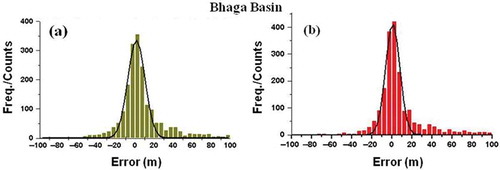
Figure 8. Quantitative representation of vertical error distribution for Chandra basin in original DEM (a) and rectified DEM (b).
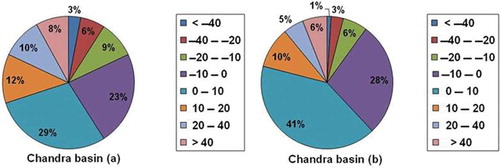
Figure 9. Quantitative representation of vertical error distribution for Bhaga basin in original DEM (a) and rectified DEM (b).