Figures & data
Figure 1. Study area and a land cover map. For full color versions of the figures in this paper, please see the online version.
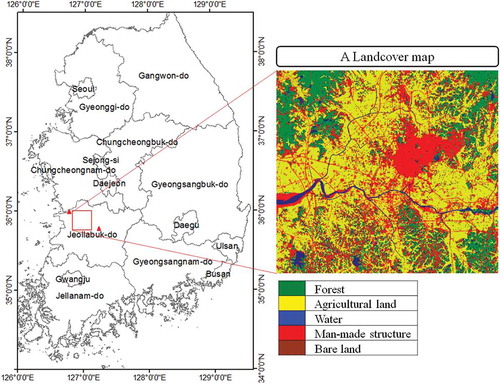
Figure 2. Flowchart of the image simulation model.
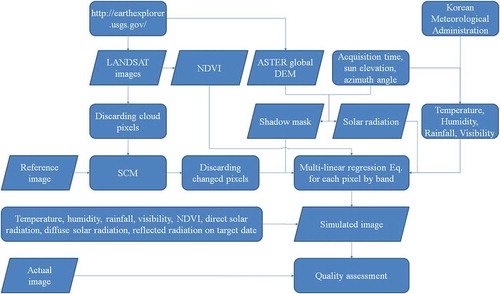
Figure 3. Images in their natural colors for the 22 September 2006 target date: (a) actual image obtained on the target date; (b) reference image acquired on 12 October 2005; (c) simulated image without NDVI and the reference image; (d) simulated image using NDVI; (e) simulated image using NDVI and the reference image.
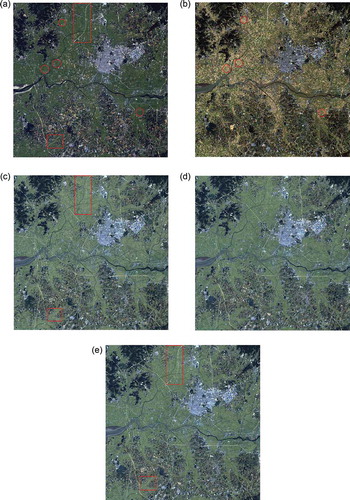
Table 1. Summary of F-test p-values for 22 September 2006 simulation.
Table 2. Summary of F-test p-values for 11 March 2014 simulation.
Table 3. R2 statistics of multilinear regression without the aid of NDVI and a reference image.
Figure 4. Images in their natural colors for the 11 March 2014 target date: (a) actual image obtained on the target date; (b) reference image acquired on 27 October 2013; (c) simulated image without NDVI and the reference image; (d) simulated image using NDVI; (e) simulated image using NDVI and the reference image.
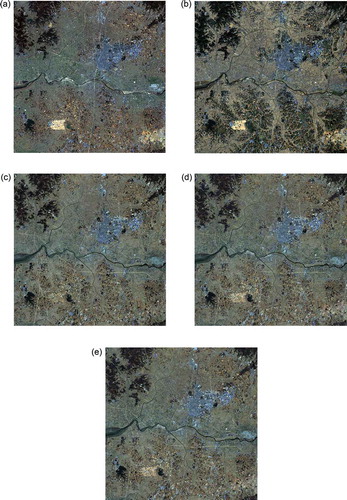
Table 4. R2 statistics of multilinear regression with the aid of NDVI.
Table 5. R2 statistics of multilinear regression with the aid of NDVI and a reference image.
Figure 5. Histogram of correlation coefficients between the simulated and actual images acquired on (a) 22 September 2006 and (b) 11 March 2014.
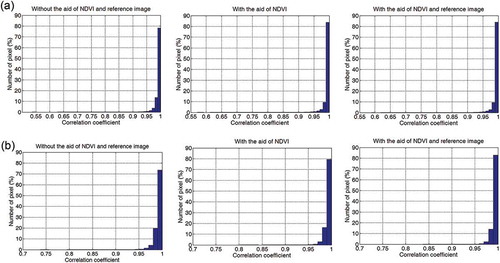
Table 6. Correlation coefficient statistics of the actual and simulated images.
Figure 6. Spectral profile (top) and histogram of correlation coefficients (bottom) for man-made areas with the 22 September 2006 target date.
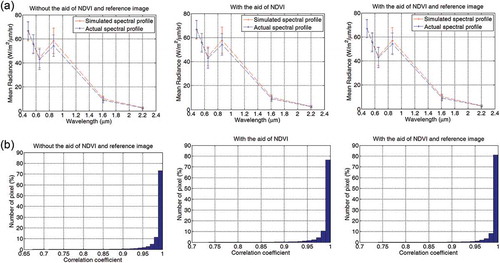
Figure 7. Spectral profile (top) and histogram of correlation coefficients (bottom) for man-made areas with the 11 March 2014 target date.
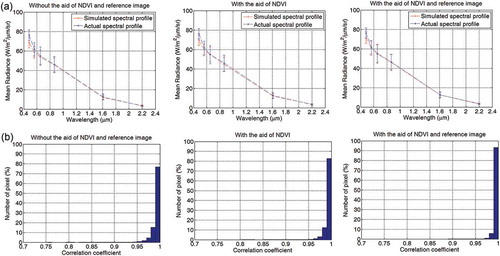
Table 7. RRMSE value of pixel radiance for each band.
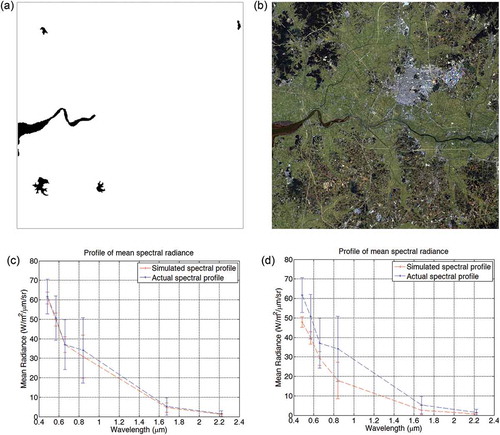
Figure 8. Image simulation with and without SWBD for the target date of 22 September 2006: (a) SWBD; (b) simulated image with a reference image and SWBD; (c) mean spectral radiance profile without SWBD; and (d) mean spectral radiance profile with SWBD.