Figures & data
Figure 1. Study area location of Lerma–Chapala–Santiago (LCS) watershed, with apparent change and persistence, 2001–2007. For full color versions of the figures in this paper, please see the online version.
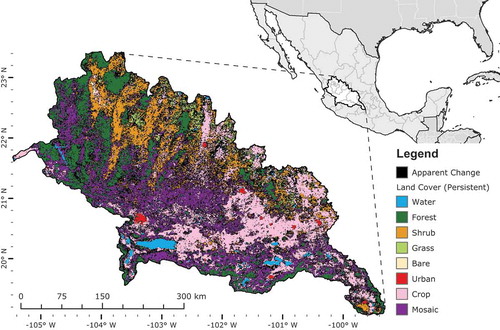
Figure 2. Confusion index values across the LCS watershed based on Classification Uncertainty Metrics for Land Cover Classifications, 2001–2007.
Table 1. Legend scheme and area of land cover classes, 2001 and 2007.
Figure 3. Average Mahalanobis typicality values for discrete land cover classes and the entire region.
Table 2. Metrics of classification uncertainty and confusion index for selected sample plots.
Table 3. Average metrics of classification uncertainty and confusion index by land cover and transition type across LCS watershed.
Table 4. Accuracy assessment of land cover classifications.
Table 5. Land cover composition and change by area, 2001–2007.
Table 6. Rank of apparent land cover transitions by impacted area, 2001–2007.
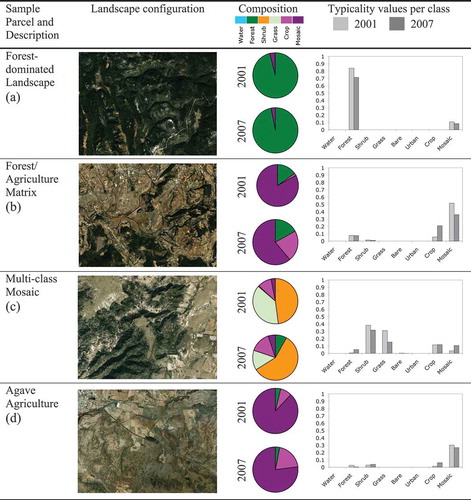
Figure 4. Landscape composition and typicality values for select sample parcels.